What’s the Outlook for Alaska Air Group?
Alaska Air Group’s (ALK) operating revenue rose 6% and 35% in 2016 and 9M17, respectively.
Jan. 12 2018, Updated 12:15 p.m. ET

What led to operating revenue growth for Alaska Air Group?
Alaska Air Group’s (ALK) operating revenue rose 6% and 35% in 2016 and 9M17, respectively. Passenger revenue, freight, and mail and other revenue drove the growth in both periods.
How much did EPS rise?
ALK’s gross profit rose 10% and 16% in 2016 and 9M17, respectively. Its operating expenses increased 13% and 39% in 2016 and 9M17, respectively, as every operating expense head noted a rise. Operating income rose 4% in 2016 before falling 1% in 9M17. Adjusted operating income rose 10% and 5% in 2016 and 9M17, respectively.
Interest expense decreased in 2015 before rising in 2016 and 9M17. Adjusted net income rose 8% in 2016 and remained flat in 9M17. Adjusted diluted EPS (earnings per share) rose 12% and 1% in 2016 and 9M17, respectively. Share buybacks enhanced EPS.
Dividend and price growth
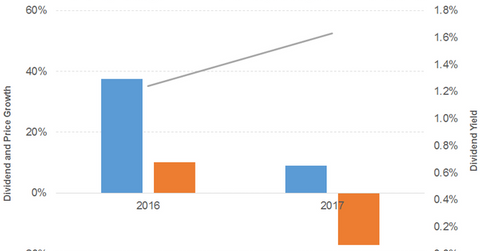
ALK’s dividend per share rose 38% and 9% in 2016 and 2017, respectively. Prices rose 10% in 2016 and fell 17% in 2017. That led to a flat upward sloping dividend yield curve. A forward PE (price-to-earnings) ratio of 11.0x and a dividend yield of 1.6% compare to a sector average forward PE ratio of 7.9x and a dividend yield of 1.4%.
How does ALK compare to the broader indexes?
The S&P 500 (SPX-INDEX) (SPY) offers a dividend yield of 2.2%, a PE ratio of 23.4x, and a YTD (year-to-date) return of 19.6%. The Dow Jones Industrial Average (DJIA-INDEX) (DIA) has a dividend yield of 2.2%, a PE ratio of 22.3x, and a YTD return of 25.1%. The NASDAQ Composite (COMP-INDEX) (ONEQ) has a PE ratio of 28.2x and a YTD return of 24.8%.
What’s the operating revenue and EPS outlook?
Alaska Air Group is being projected to have a 34% operating revenue growth in 2017 followed by a 9% growth in 2018. Its diluted EPS is being projected to fall 8% in 2017 and 3% in 2018.
