Is Natural Gas a Good Short for Bears at $3?
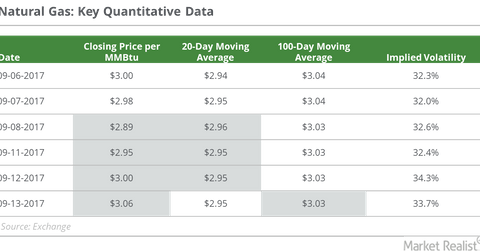
On September 13, natural gas October futures closed at $3.058 per MMBtu (million British thermal units). The same day, natural gas prices rose 1.9%.
Sept. 15 2017, Updated 8:07 a.m. ET

Natural gas
On September 13, 2017, natural gas (UNG) (FCG) October futures closed at $3.058 per MMBtu (million British thermal units). On the same day, natural gas prices rose 1.9%. Between September 6 and 13, natural gas futures rose by the same percentage.
During this period, US crude oil (USO) (USL) October futures rose 0.3%. In the seven calendar days to September 13, 2017, the two broader market equity indexes, the S&P 500 Index (SPY) and the Dow Jones Industrial Average Index (DIA), rose 1.3% and 1.6%, respectively.
Energy prices could be important for these equity indexes. Earlier the same week, natural gas prices rose due to warmer weather in the US Midwest.
EIA’s STEO
The EIA (US Energy Information Administration) released its STEO (short-term energy outlook) report on September 12, 2017. Based on this report, on a YoY (year-over-year) basis, in September 2017, electric power generators could consume 3.35 Bcf (billion cubic feet) per day less natural gas.
Overall, in September, natural gas consumption in the US could fall by 2.79 Bcf (billion cubic feet) per day, compared with the same time in 2016. This could concern long traders around the psychologically important $3 level. Moreover, the EIA expects natural gas spot prices to average around $3.05 per MMBtu (million British thermal units) in 2017.
Moving averages
On September 13, 2017, natural gas active futures were 3.6%, 4.2%, and 1% above their 20-day, 50-day, and 100-day moving averages, respectively. On the same day, natural gas futures moved above their 100-day moving average. These are short-term bullish signs for natural gas futures.
However, the 50-day moving average was still 5.7% below the 200-day moving average, which could limit bullish bets on natural gas prices.
