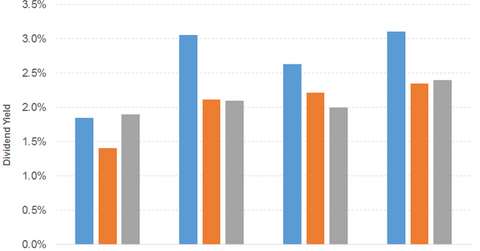
Dividend Yield of Archer-Daniels Midland
Archer-Daniels Midland’s (ADM) PE ratio of 19.1x compares to a sector average of 23.8x. The dividend yield of 3.1% compares to a sector average of 2.4%.
Aug. 23 2017, Published 12:43 p.m. ET

Archer-Daniels Midland: Consumer goods sector, farm products industry
Archer-Daniels Midland (ADM) is a worldwide food processing and commodities trading company. Its revenues have fallen over the years through fiscal 2016. The decline has been driven by lower contributions from the agricultural services, corn processing, and oilseeds processing segments. Wild Flavors & Specialty Ingredients was the only sector to witness some growth. EPS (earnings per share) fell significantly due to higher operating expenses and lower earnings from business investments, partially offset by share buybacks.
Revenue for the first half of 2017 also fell due to a decline in every segment except oilseeds processing. The company recorded growth in gross profits and higher earnings from business investments, which offset the effect of higher operating and interest expenses. That led to a rise in EPS, which was also influenced by share buybacks.
In the graph below, we can see Archer-Daniels Midland’s dividend yield compared to the S&P 500 and Bunge (BG). (The asterisk in the graph denotes an approximation in calculating dividend yield.)
Dividend rises and falls
Archer-Daniels Midland’s August 2017 dividend announcement is its 343rd successive quarterly payment. Free cash flow has fallen over the years with earnings. However, the company’s dividend yield has seen rises and falls and is currently beating the S&P 500.
The company’s PE (price-to-earnings) ratio of 19.1x compares to a sector average of 23.8x. The dividend yield of 3.1% compares to a sector average of 2.4%. In the graph below, we can see Archer-Daniels Midland’s price movement compared to the S&P 500 and Bunge.
Archer-Daniels Midland’s significant acquisitions in 2016 and 2017 included the following:
- Crosswind Industries, a leading manufacturer of contract and private label pet delicacies and foods
- Biopolis SL, a principal provider of microbial technology
- Chamtor, a French producer of wheat-based sweeteners and starches
- Industries Centers, an Israeli company focused on the import and distribution of agricultural feed products
- Casablanca, Morocco-based producer of glucose and native starch
- Amazon Flavors, a chief Brazilian manufacturer of natural extracts, emulsions, and compounds
- Cairo-based Medsofts Group, a consolidated joint venture that possesses and accomplishes merchandising and supply chain operations
- Harvest Innovations, specializing in minimally processed, expeller-pressed soy proteins, oils, and gluten-free ingredients
The PowerShares High Yield Equity Dividend Achievers ETF (PEY) offers a dividend yield of 2.8% at a PE ratio of 18.6x. The diversified ETF has a substantial exposure to utilities. The First Trust Morningstar Dividend Leaders ETF (FDL) offers a dividend yield of 3.3% at a PE ratio of 19.9x. It’s a diversified ETF.
