PowerShares High Yld Eq Div Achiev™ ETF
Latest PowerShares High Yld Eq Div Achiev™ ETF News and Updates
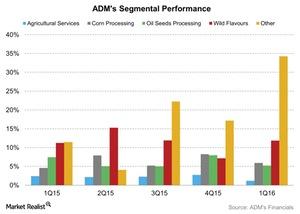
How’s ADM Advancing with Its Portfolio Management Strategy?
As part of its portfolio management strategy, Archer Daniels Midland (ADM) sold its Brazilian sugar cane ethanol operations.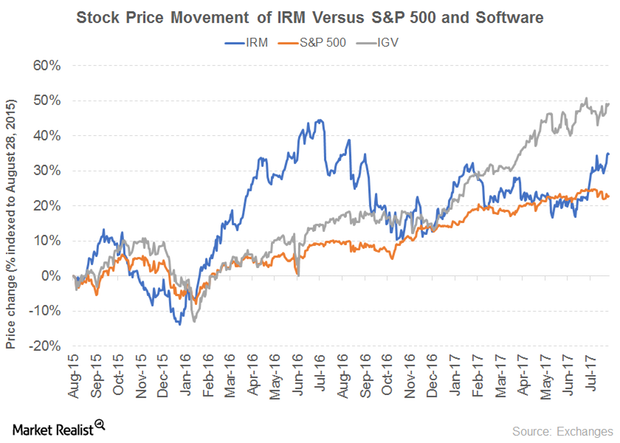
How Iron Mountain Has Maintained Its Dividend Yield
How Iron Mountain has maintained a 5% yield Iron Mountain (IRM) is an enterprise information management services company. The company’s revenue grew in 2016, supported by its North American Records and Information Management Business, North American Data Management Business, Western European Business, and Other International Business segments. Its revenue fell 4% in 2015 before rising 17% in 2016. Its operating income fell 5% in 2015 and 4% in 2016 due to […]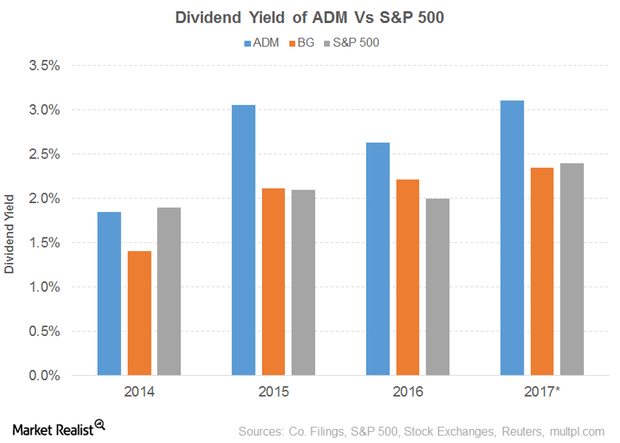
Dividend Yield of Archer-Daniels Midland
Archer-Daniels Midland’s (ADM) PE ratio of 19.1x compares to a sector average of 23.8x. The dividend yield of 3.1% compares to a sector average of 2.4%.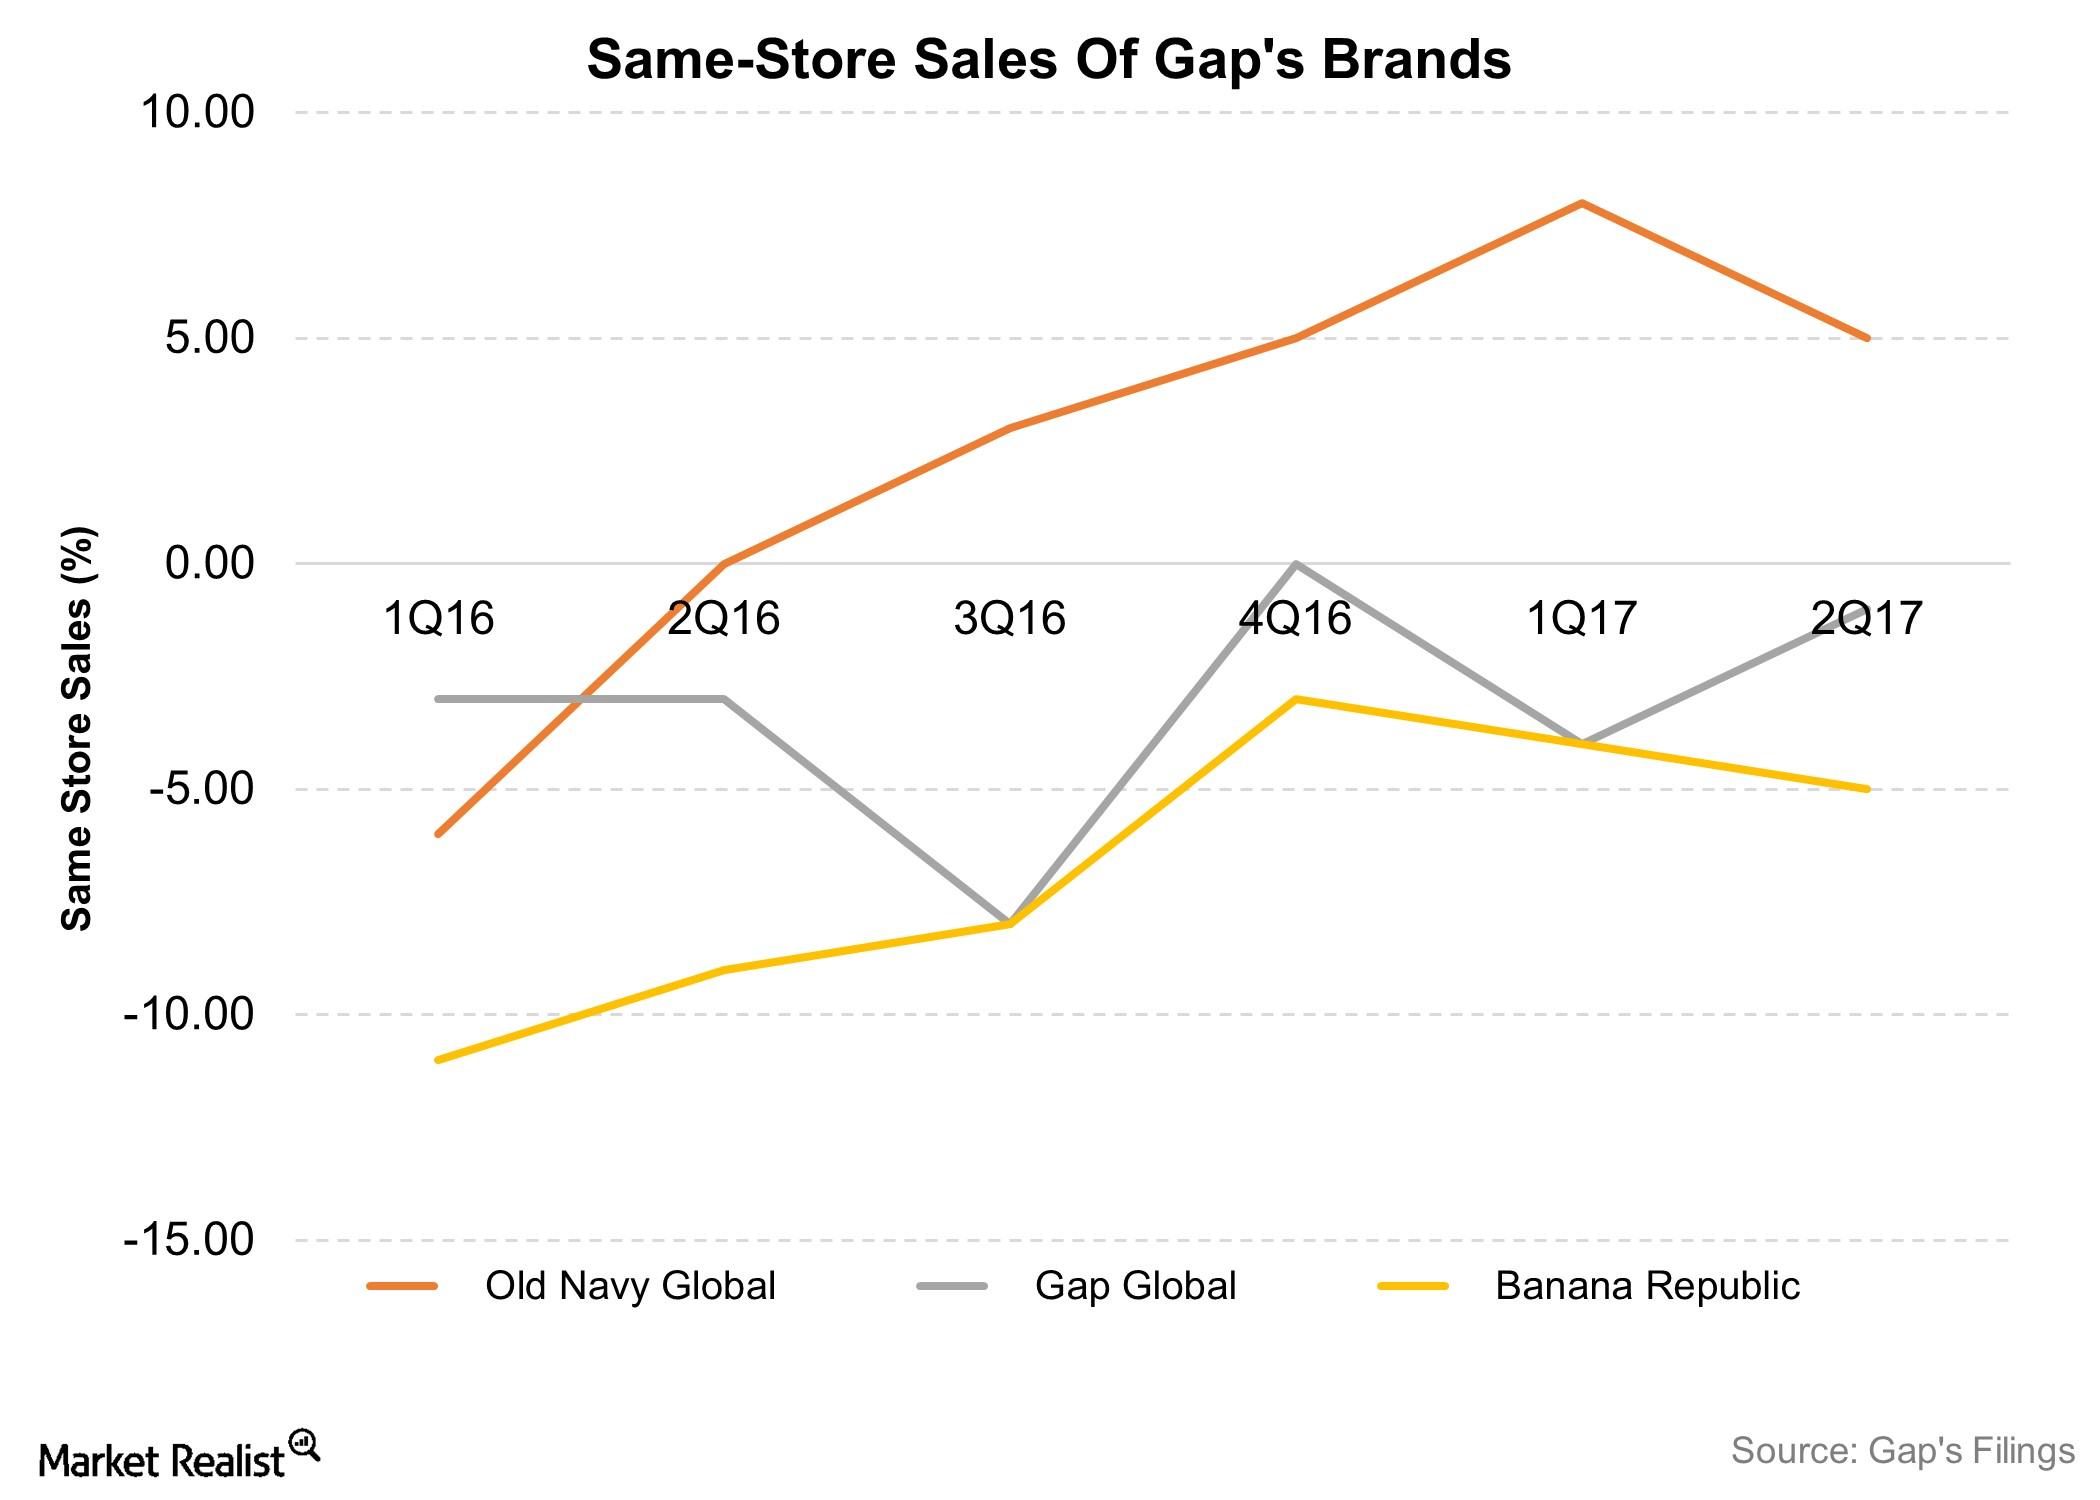
Analyzing Gap’s 2Q17 Top-Line Performance
Gap (GPS) reported total revenues of $3.8 billion in 2Q17 and beat the consensus by $30 million. On a YoY basis, the company’s top line fell 1.4%.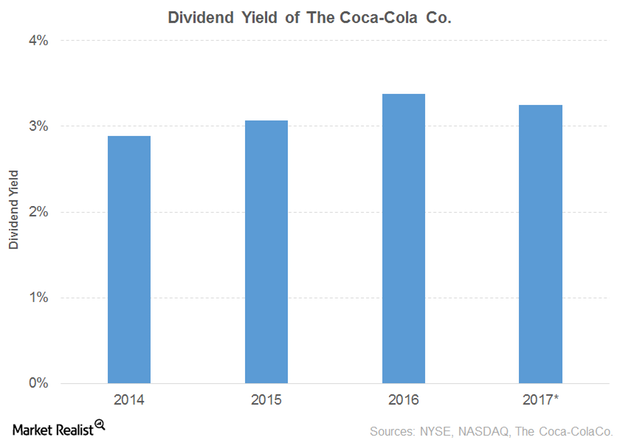
A Look at Coca-Cola’s Dividend Yield
Coca-Cola (KO) recorded a fall of 6.0% in its 2016 net operating revenues due to a decline in its Third Party and Intersegment segments.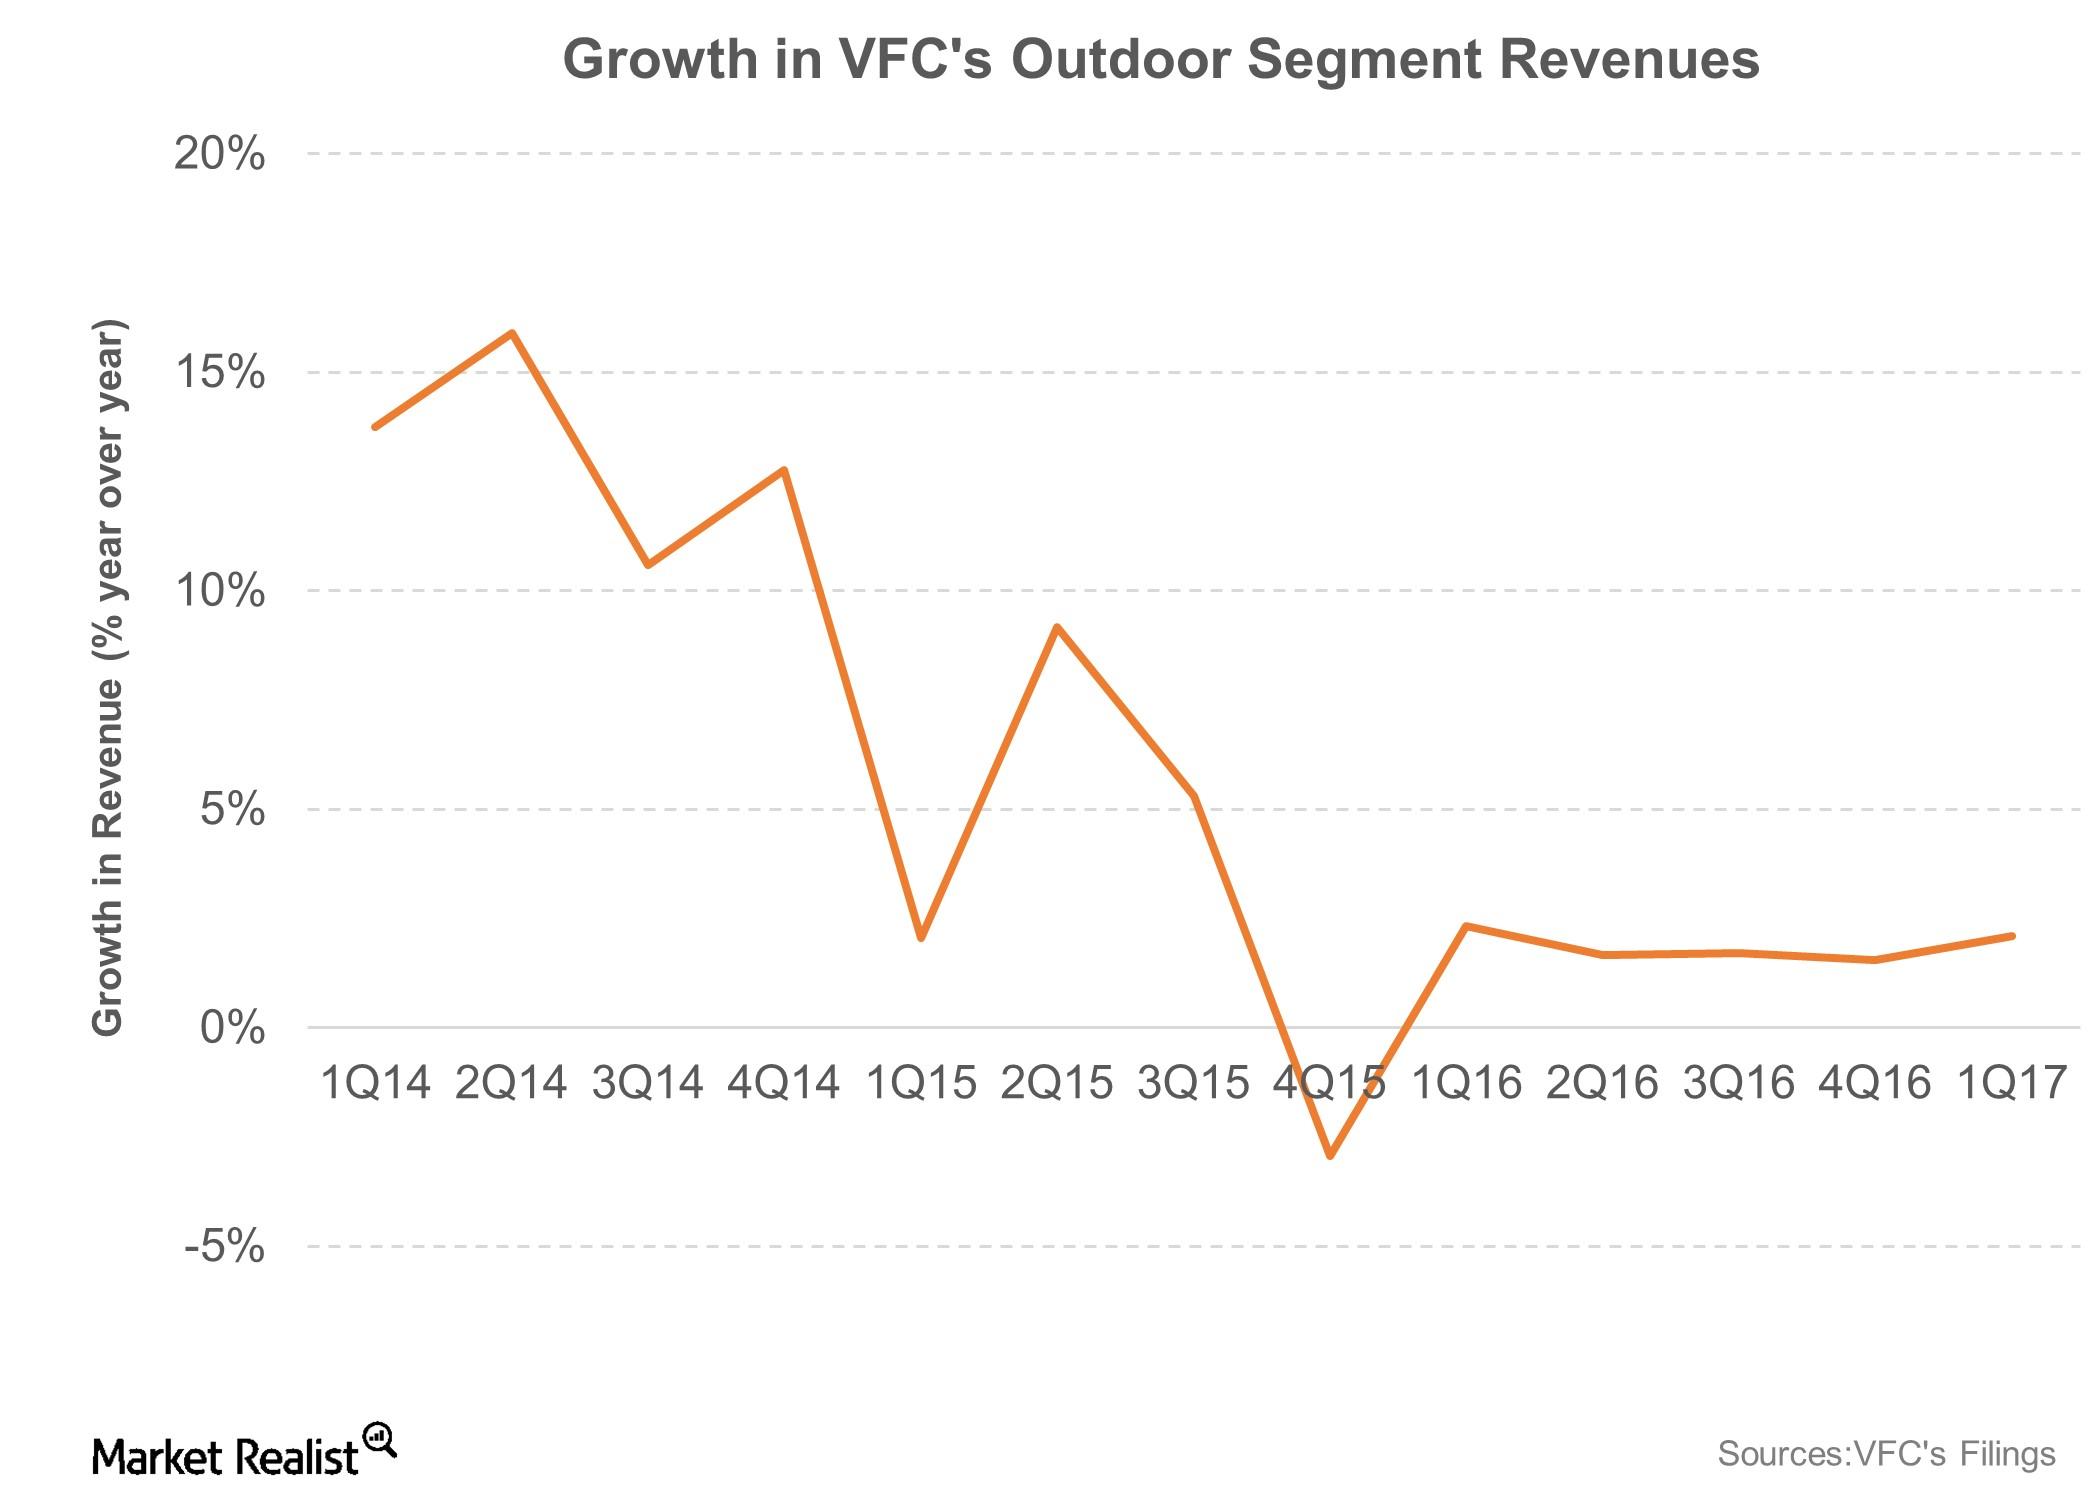
2Q17 Performances for VF’s North Face, Vans, and Timberland
VF’s Outdoor & Action Sports segment, which focuses on Vans, North Face, and Timberland, recorded a 4.0% YoY rise in sales to $1.5 billion.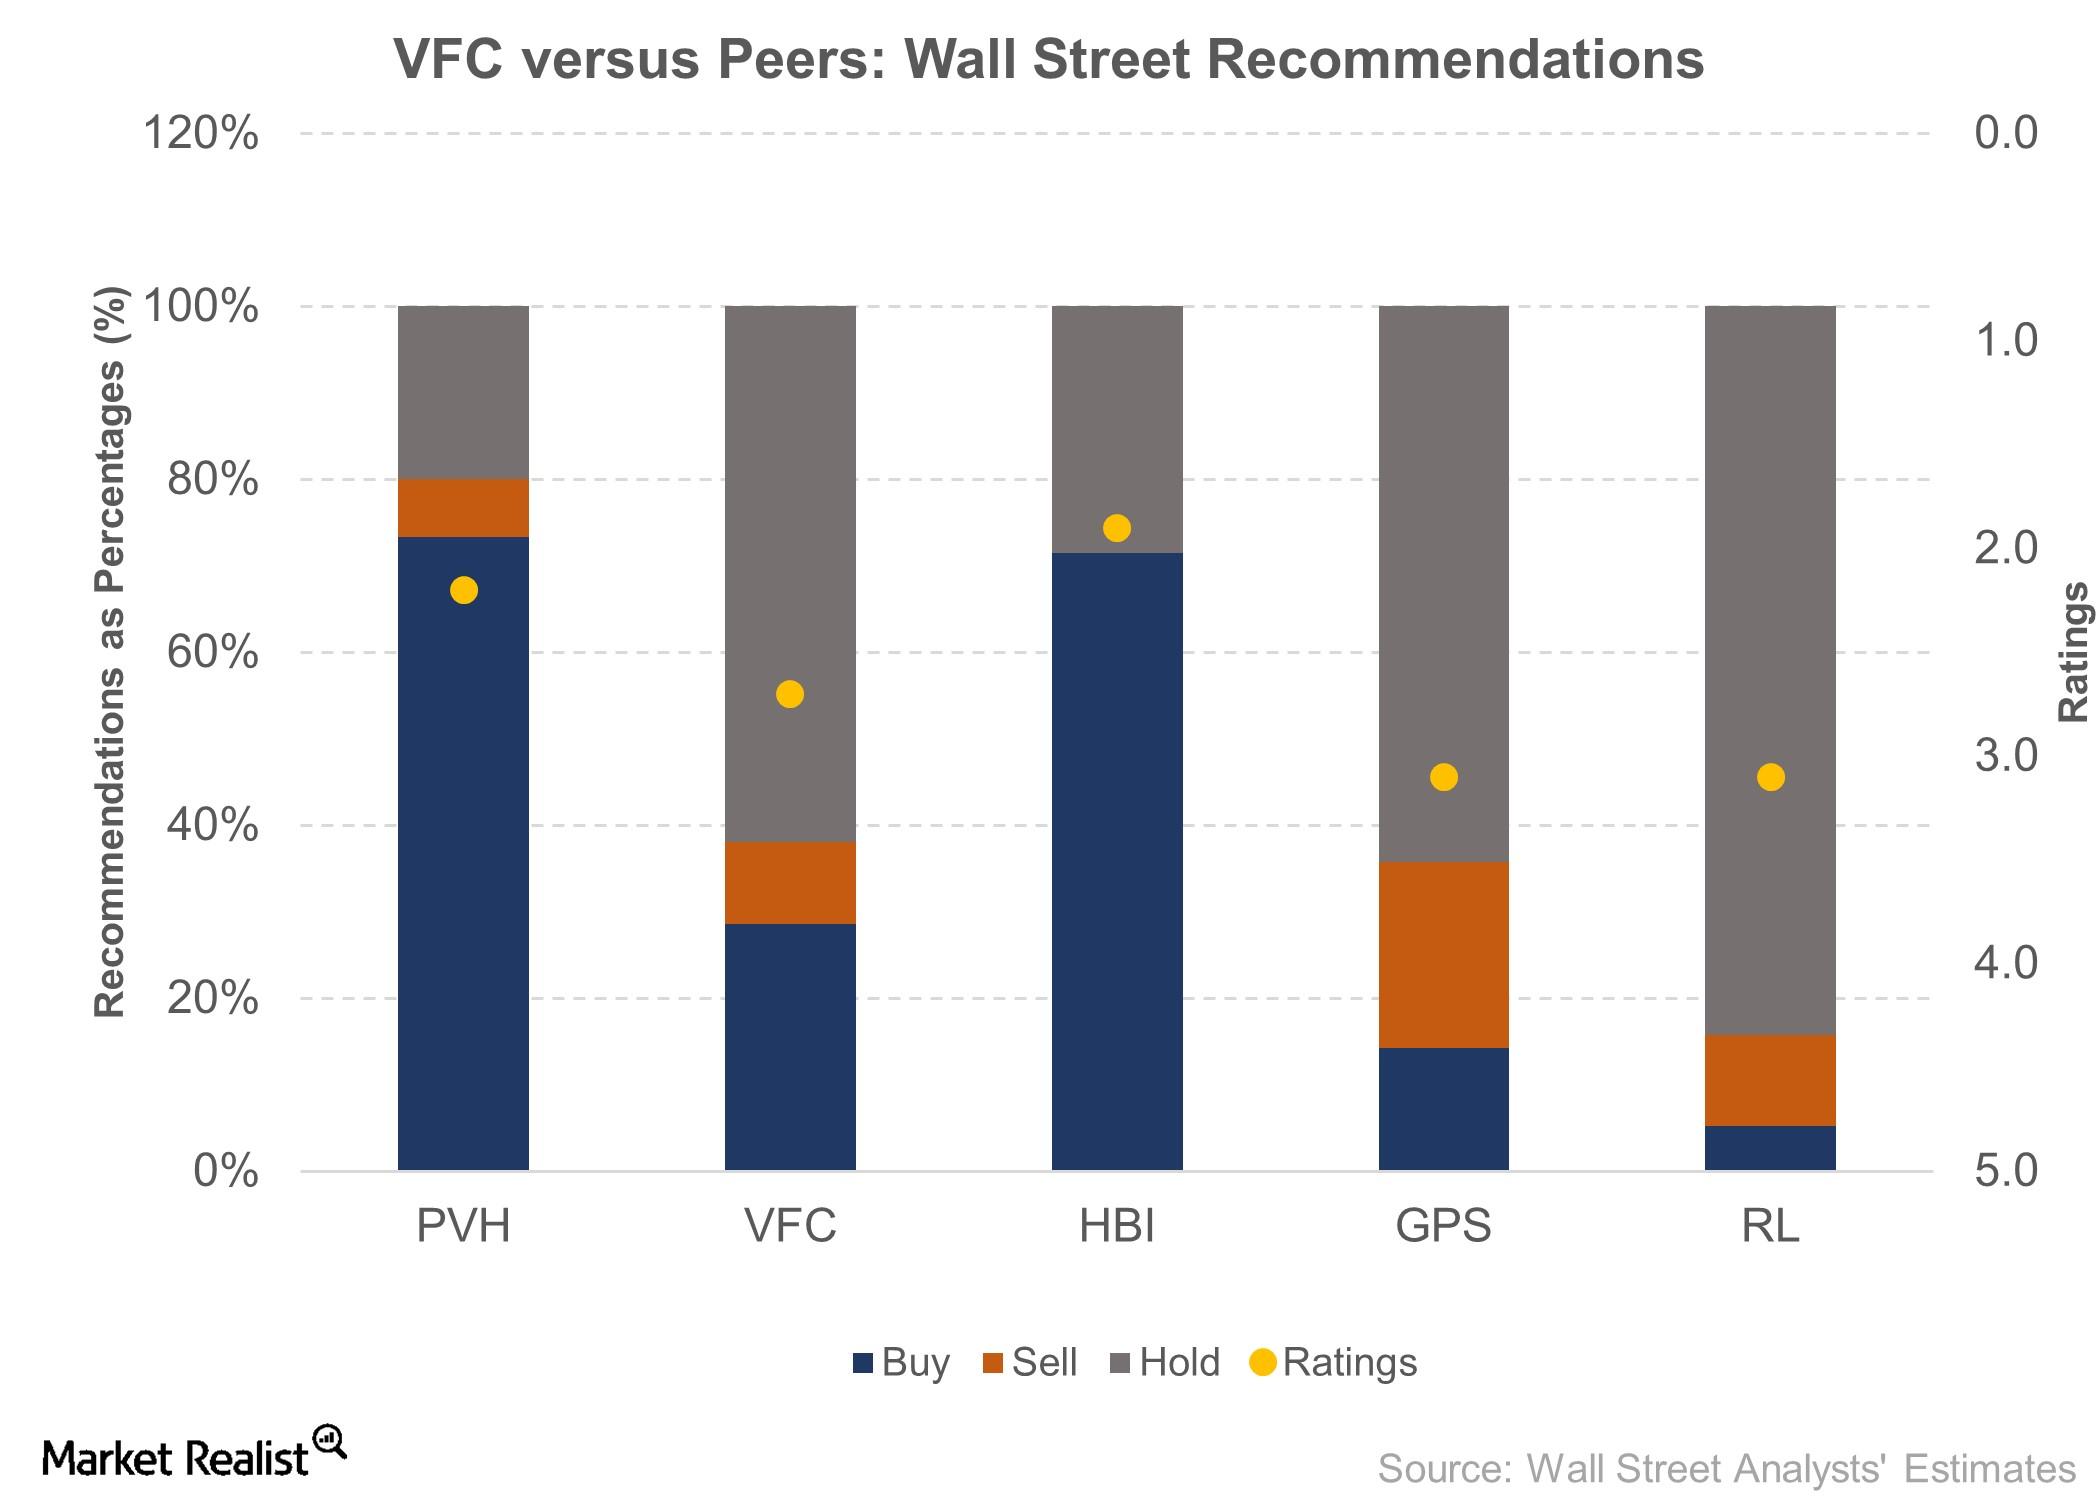
What Wall Street Recommends for VFC ahead of 2Q17 Results
VFC is covered by 21 Wall Street analysts. It has received a 2.7 rating on a scale where one is a “strong buy” and five is a “strong sell.”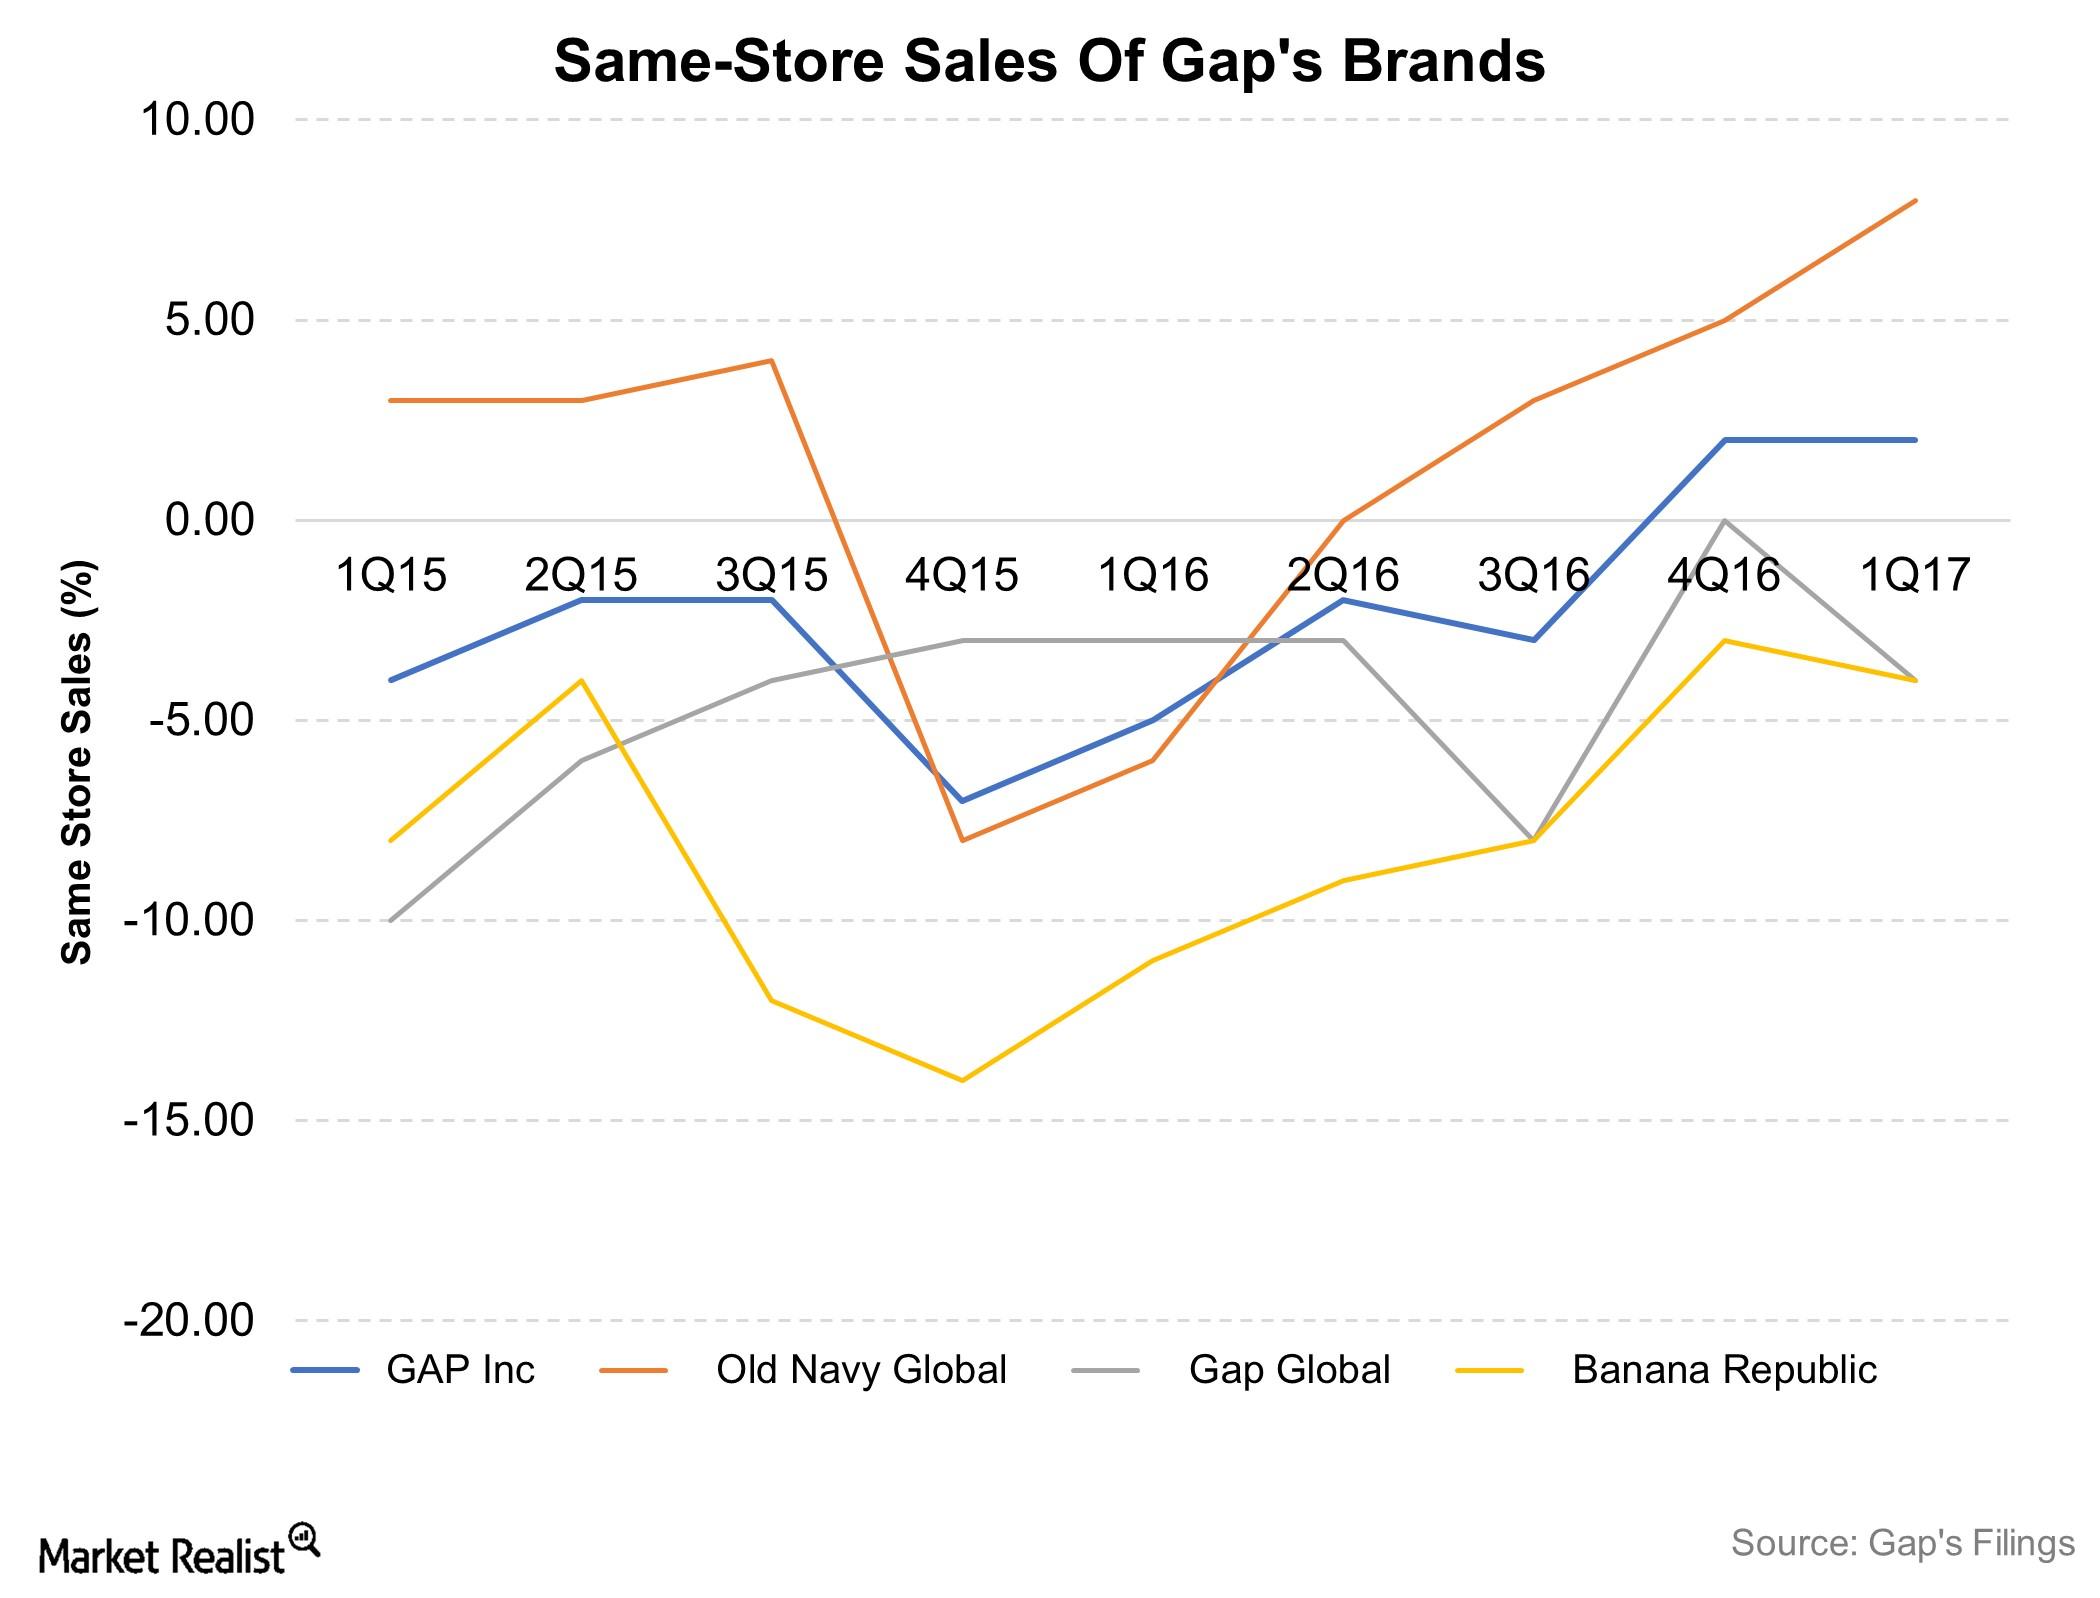
Gap’s 1Q17 Top-Line Growth Driven Entirely by Old Navy
Gap (GPS) reported total revenues of $3.4 billion in fiscal 1Q17, beating the consensus by $50.0 million. YoY, its top line remained almost flat.
The North Face and Vans Drive VF Corporation’s 1Q17 Top Line
VFC’s Outdoor & Action Sports segment, which mainly focuses on Vans, The North Face, and Timberland, recorded a 2.1% YoY rise in sales to $1.7 billion.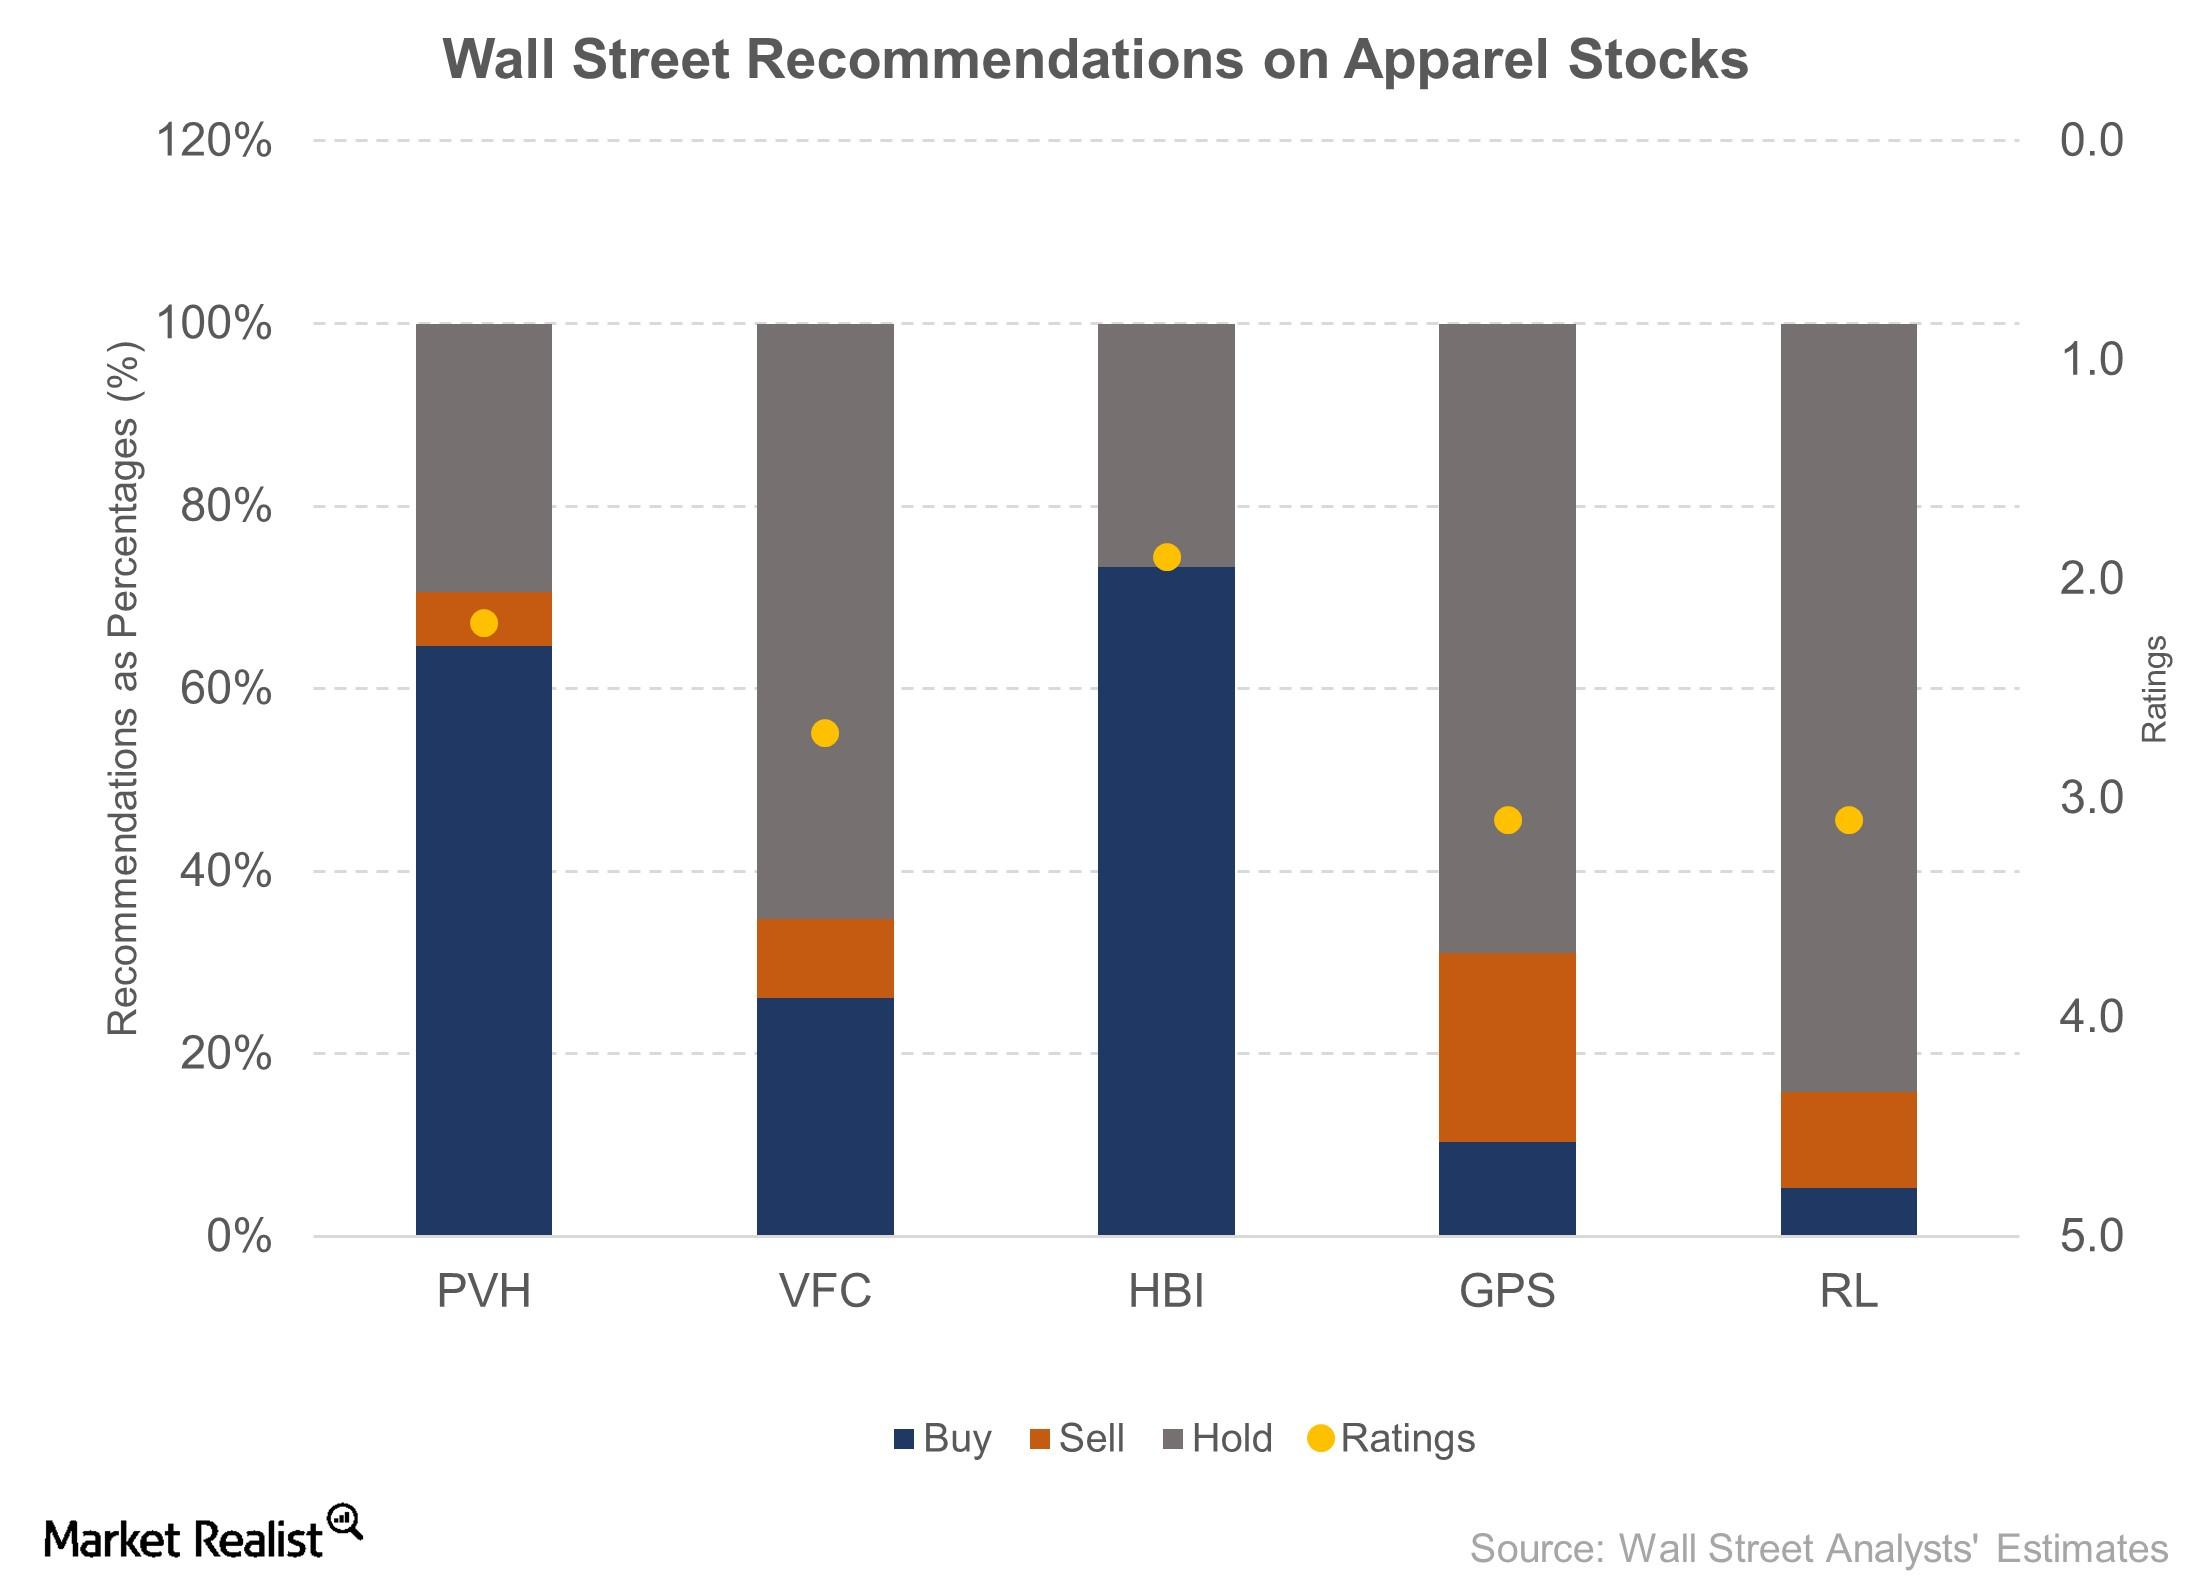
Why VF Corporation Stock Has a Downside of 4%
VFC stock is currently trading at $56.44, which is ~17.0% below its 52-week high price.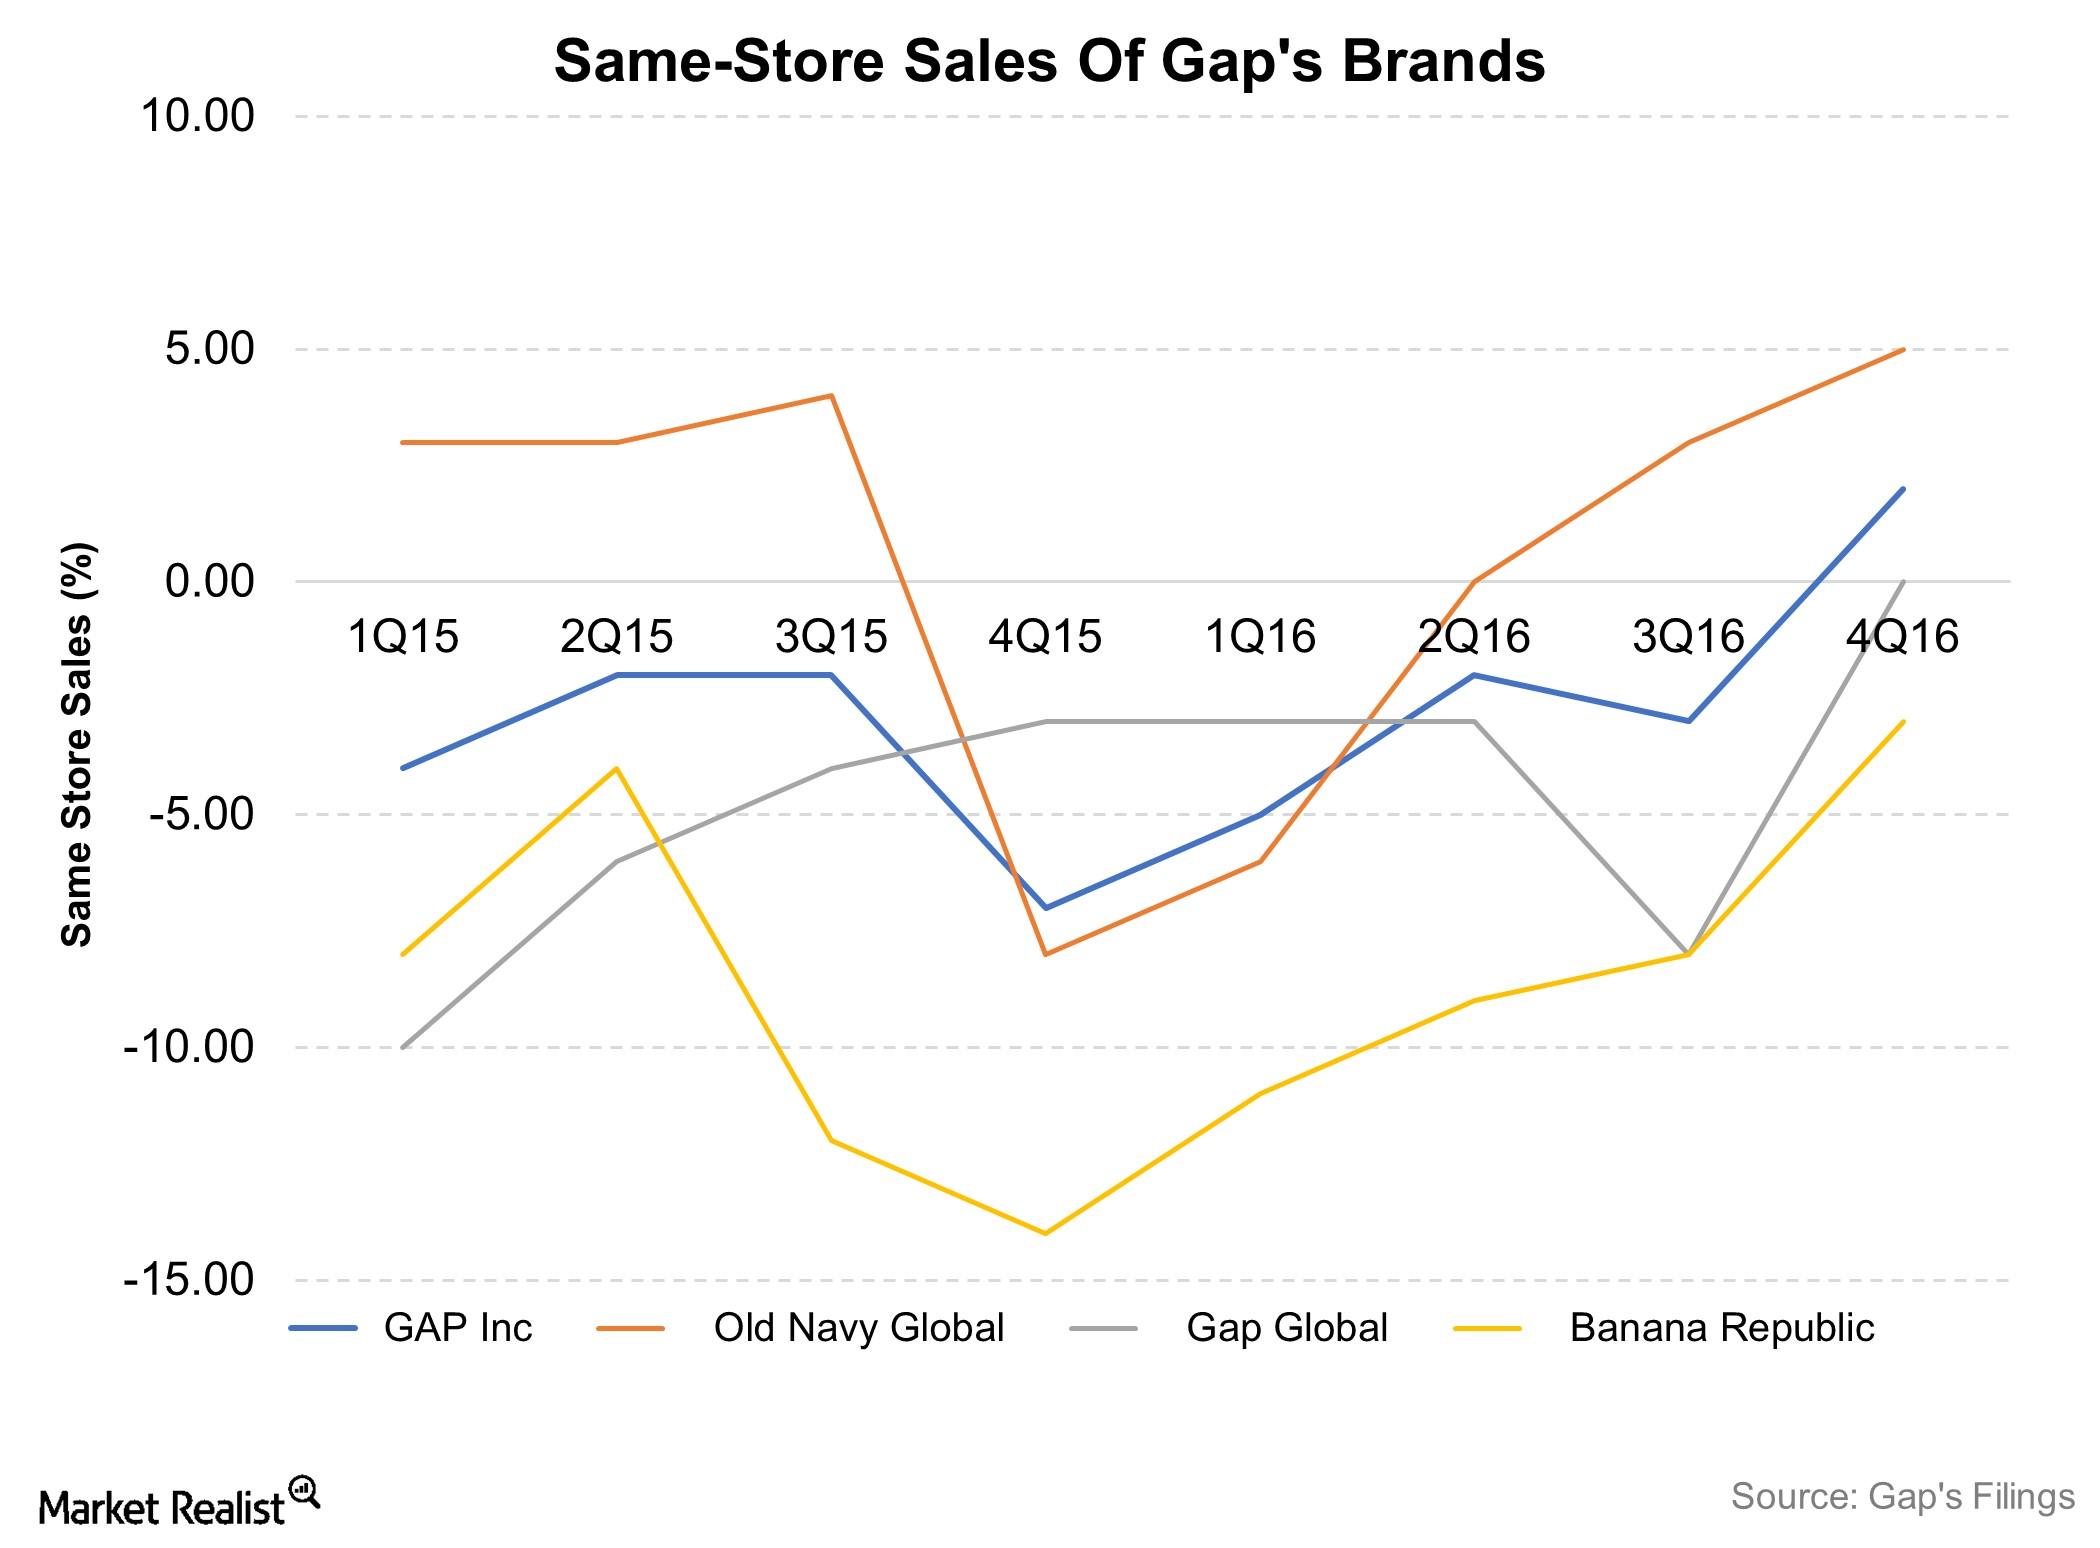
Why Gap’s CEO Is Projecting Optimism after 4Q16
Gap (GPS) reported total revenues of ~$4.4 billion in 4Q16, beating the consensus by $40 million.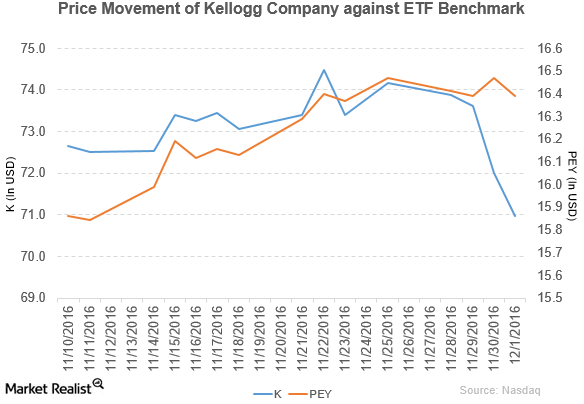
Why Did Breitbart Ask Its Readers to Boycott Kellogg?
Kellogg reported fiscal 3Q16 net sales of $3.25 billion—a fall of 2.4% from net sales of $3.33 billion in fiscal 3Q15 due to unfavorable currency headwinds.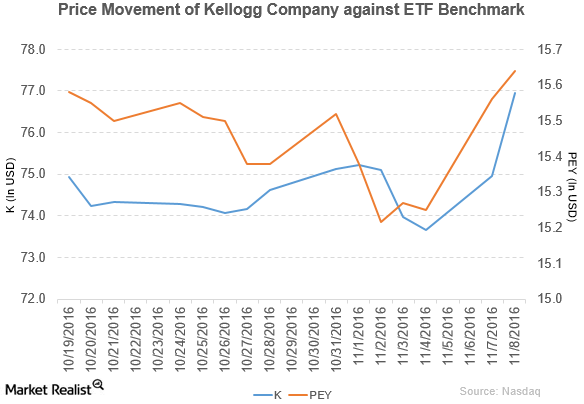
Why Did Kellogg Rise on November 8?
Price movement Kellogg (K) has a market cap of $27.4 billion. It rose 2.7% to close at $76.96 per share on November 8, 2016. The stock’s weekly, monthly, and year-to-date (or YTD) price movements were 2.3%, 0.64%, and 8.6%, respectively, on the same day. Kellogg is trading 2.8% above its 20-day moving average, 0.17% below […]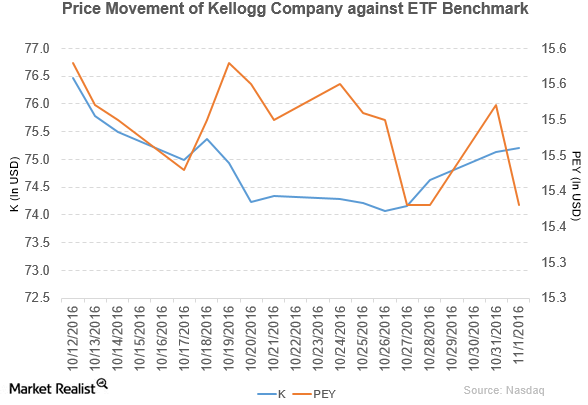
A Look at Kellogg’s 3Q16 Performance
Price movement Kellogg (K) has a market cap of $26.4 billion. It rose 0.11% to close at $75.21 per share on November 1, 2016. The stock’s weekly, monthly, and year-to-date (or YTD) price movements were 1.4%, -2.6%, and 6.1%, respectively, on the same day. Kellogg is trading 0.07% below its 20-day moving average, 3.4% below […]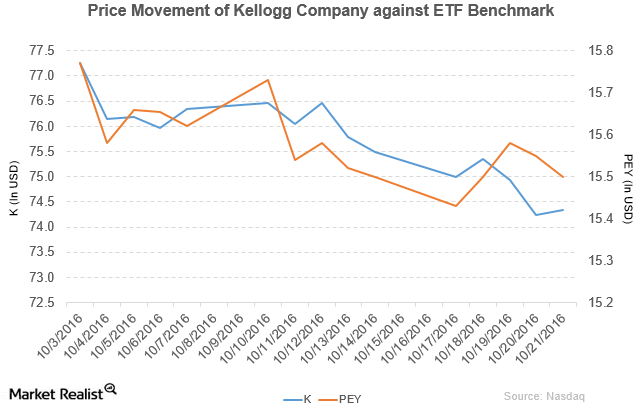
Kellogg Declares Dividend of $0.52 per Share
Price movement Kellogg (K) has a market cap of $26.0 billion. It rose 0.15% to close at $74.34 per share on October 21, 2016. The stock’s weekly, monthly, and year-to-date (or YTD) price movements were -1.5%, -5.0%, and 4.9%, respectively, on the same day. K is trading 2.6% below its 20-day moving average, 5.9% below […]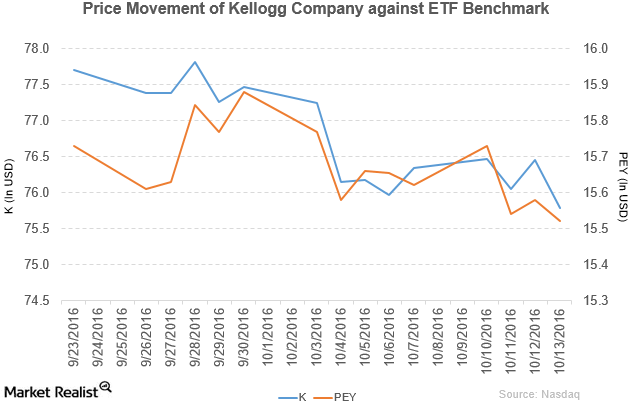
How Are Those Cheerios Sales Going? Kellogg’s Earnings in Focus
Kellogg (K) has a market cap of $26.4 billion. It fell 0.89% to close at $75.78 per share on October 13, 2016.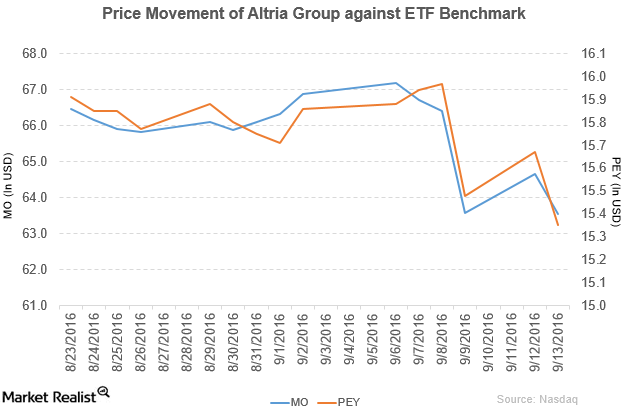
Citigroup Has Rated Altria Group a ‘Buy’
Altria Group (MO) has a market cap of $129.7 billion. It fell 1.7% to close at $63.55 per share on September 13, 2016.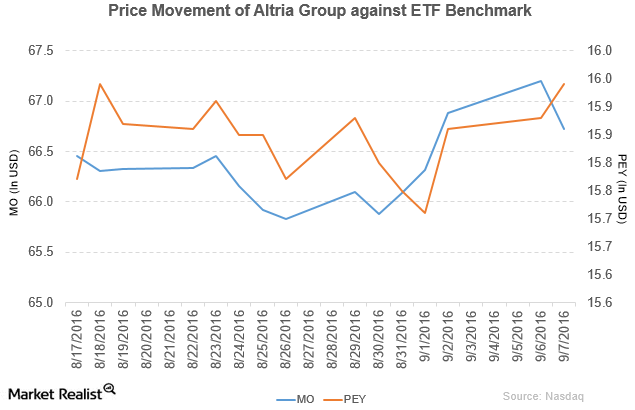
Altria Group Reaffirms Its 2016 Projections
Altria Group (MO) has a market cap of $130.4 billion. It fell by 0.71% to close at $66.72 per share on September 7, 2016.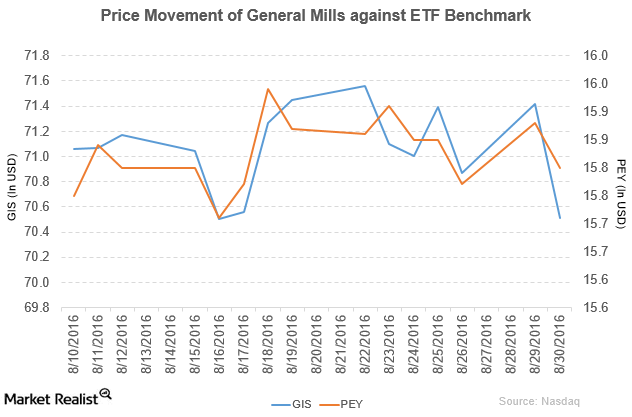
General Mills Made Key Changes in Its Management
General Mills (GIS) has a market cap of $42.6 billion. It fell by 1.3% to close at $70.51 per share on August 30, 2016.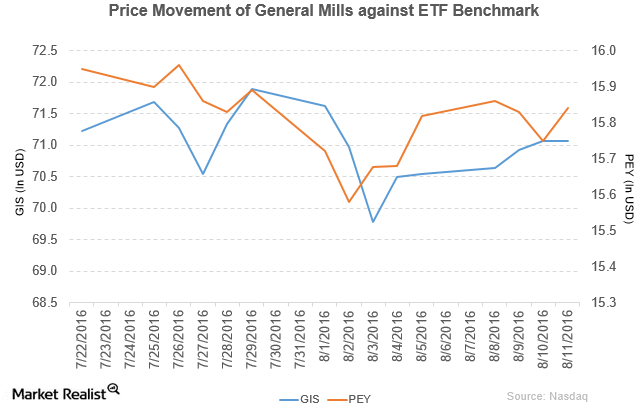
General Mills Rose by Just 0.01% on August 11: Why?
General Mills (GIS) has a market cap of $42.7 billion. It rose by 0.01% to close at $71.07 per share on August 11, 2016.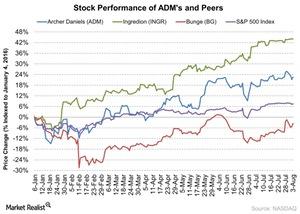
ADM’s Stock Fell 2% Due to Weaker Performance in 2Q16
Archer Daniels Midland (ADM) reported its 2Q16 results on August 2. The stock didn’t react well to the results. It fell 2% on the same day.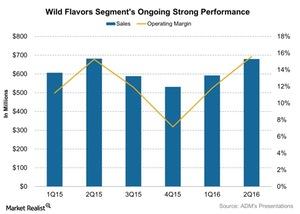
What Benefited ADM’s WILD Flavors and Specialty Ingredients in 2Q16?
Archer Daniels Midland’s management mentioned that the WILD Flavors and Specialty Ingredients’ results were in line with the same quarter last year.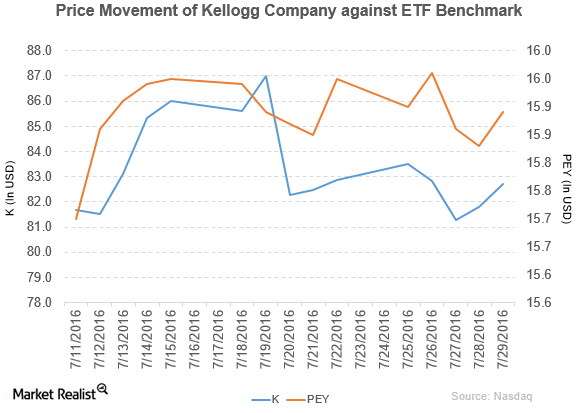
Kellogg Company Has Declared a Quarterly Dividend
Kellogg Company (K) has a market capitalization of $28.8 billion. It rose by 1.1% to close at $82.71 per share on July 29, 2016.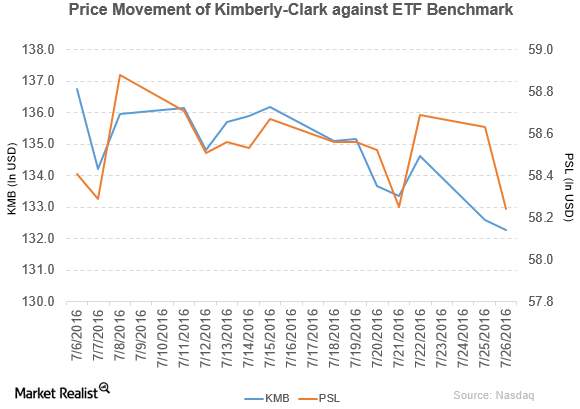
Kimberly-Clark Saw Sales for Personal Care Items Fall in 2Q
Kimberly-Clark (KMB) has a market cap of $47.7 billion. It fell by 0.23% to close at $132.28 per share on July 26, 2016.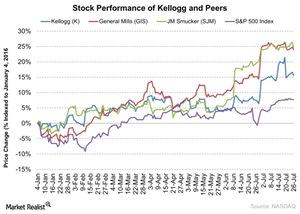
What Can Investors Expect from Kellogg’s 2Q16 Results?
Kellogg Company (K) is headquartered in Battle Creek, Michigan. It’s set to report its fiscal 2Q16 results on August 4, 2016, before the market opens.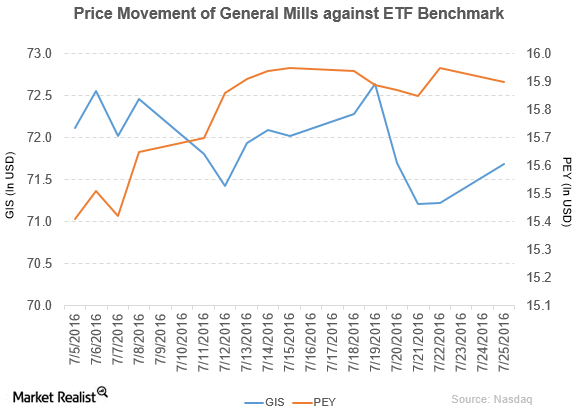
Why Did General Mills Expand the Recall of Its Products?
General Mills rose by 0.66% to close at $71.69 per share on July 25. The stock’s weekly, monthly, and YTD price movements were -0.82%, 8.1%, and 27.1%.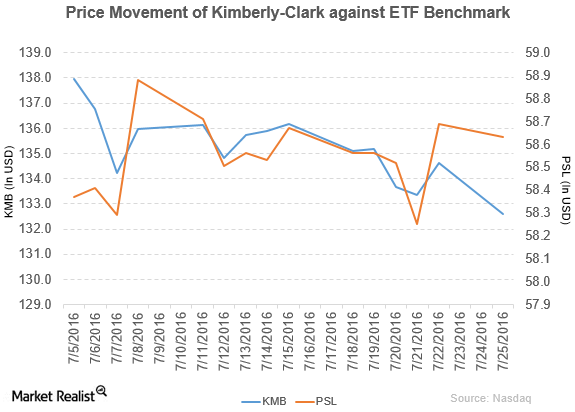
How Did Kimberly-Clark Perform in 2Q16?
Kimberly-Clark fell by 1.5% to close at $132.59 per share on July 25. The stock’s weekly, monthly, and YTD price movements were -1.9%, -1.0%, and 5.6%.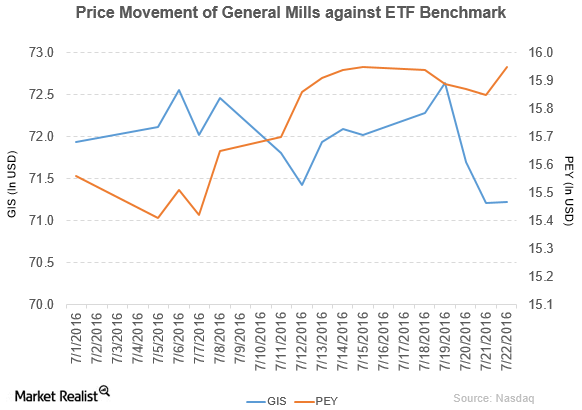
General Mills Announces Restructuring Plans
General Mills fell by 1.1% to close at $71.22 per share in the third week of July. Its weekly, monthly, and YTD price movements were -1.1%, 8.0%, and 26.2%.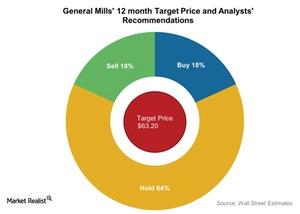
Why Are Analysts So Positive about General Mills?
About 64% of analysts rate General Mills a “hold,” 18% rate it a “sell,” and 18% rate it a “buy.”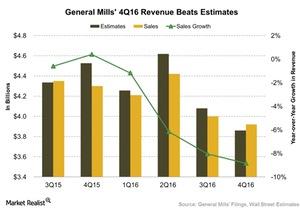
What Drove Down General Mills’ Revenue Growth for Fiscal 4Q16?
General Mills’ (GIS) net sales for fiscal 4Q16 fell 9% year-over-year. However, they beat analysts’ estimates by 2%.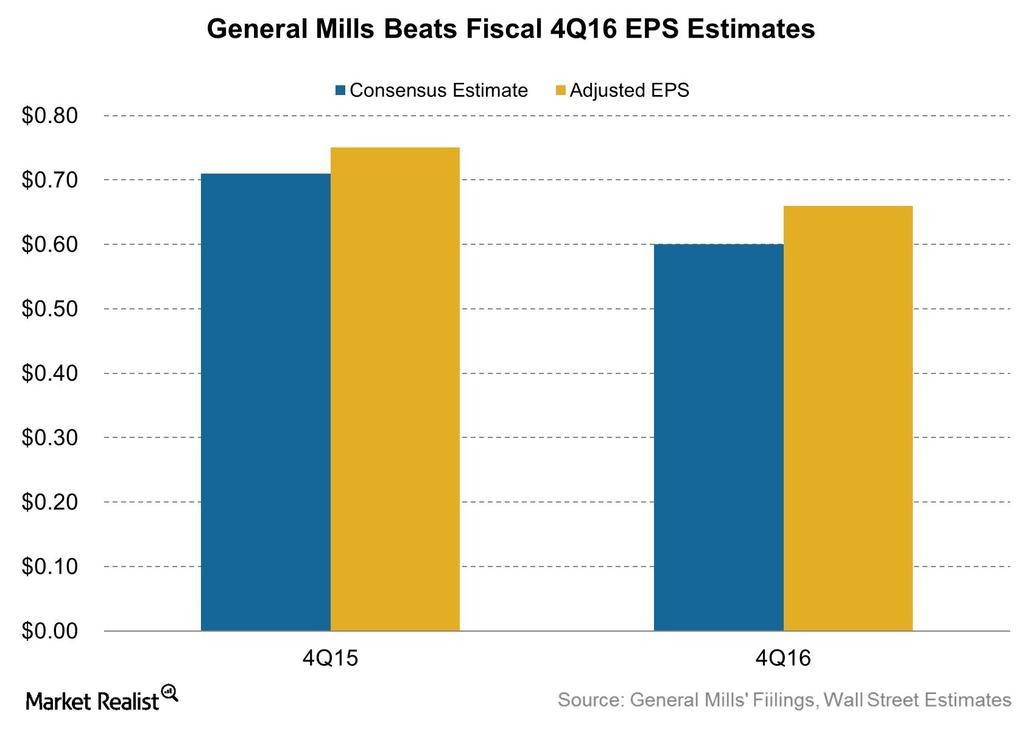
Why Did General Mills’ Earnings Fall in Fiscal 4Q16?
General Mills’ (GIS) fiscal 4Q16 earnings beat estimates by 10%. Adjusted EPS, however, declined 12% compared to fiscal 4Q15.
Why Procter & Gamble Is Selling Some of Its Brands
Procter & Gamble is on a mission to trim brands that are holding back its overall financial performance.