Bank of America/Merrill Lynch Upgrades Silgan Holdings to a ‘Buy’
On January 23, 2017, Bank of America/Merrill Lynch upgraded Silgan Holdings’s (SLGN) rating to a “buy” from “underperform.”
Nov. 20 2020, Updated 4:20 p.m. ET

Price movement 
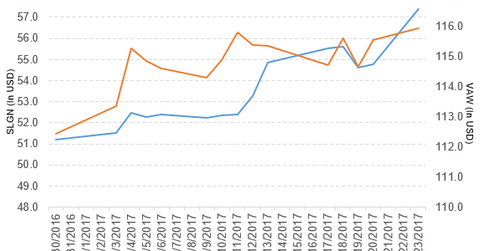
Silgan Holdings (SLGN) has a market cap of $3.2 billion. It rose 4.8% to close at $57.40 per share on January 23, 2017. The stock’s weekly, monthly, and year-to-date (or YTD) price movements were 4.6%, 12.8%, and 12.2%, respectively, on the same day.
SLGN is trading 9.1% above its 20-day moving average, 12.0% above its 50-day moving average, and 13.9% above its 200-day moving average.
Related ETF and peers
The Vanguard Materials ETF (VAW) invests 0.30% of its holdings in Silgan. The YTD price movement of VAW was 3.1% on January 23.
The market caps of Silgan’s competitors are as follows:
SLGN’s rating
On January 23, 2017, Bank of America/Merrill Lynch upgraded Silgan Holdings’s (SLGN) rating to a “buy” from “underperform.”
Latest news on SLGN
In a press release on January 23, 2017, Silgan Holdings reported, “Silgan Holdings Inc. (SLGN), a leading supplier of rigid packaging for consumer goods products, announced today that it has entered into a definitive agreement with WestRock Company (WRK) to acquire its specialty closures and dispensing systems business.”
The report added, “The purchase price for this acquisition is $1.025 billion, subject to adjustments outlined in the purchase agreement for this acquisition. The transaction is subject to the satisfaction of certain customary conditions and receipt of applicable regulatory approvals and is expected to close late in the first quarter of 2017.
“Silgan expects to initially fund the purchase price for this acquisition from a combination of cash on hand and borrowings under the Company’s senior secured credit facility, including a committed incremental term loan.”
Performance of Silgan Holdings in 3Q16
Silgan Holdings reported 3Q16 net sales of ~$1.1 billion, a fall of 5.3% compared to net sales of $1.2 billion in 3Q15. The company’s gross profit margin and operating margin expanded 60 basis points each in 3Q16 compared to 3Q15.
Its net income and EPS (earnings per share) fell to $69.8 million and $1.15, respectively, in 3Q16 compared to $70.3 million and $1.16, respectively, in 3Q15. It reported adjusted EPS of $1.23 in 3Q16, a fall of 2.4% compared to 3Q15.
Silgan’s cash and cash equivalents fell 6.3%, and its inventories rose 1.6% between 3Q16 and 4Q15.
Projections
Silgan Holdings (SLGN) has projected its adjusted EPS in the range of $2.70–$2.80, which excludes rationalization charges for fiscal 2016. It also expects the adjusted EPS in the range of $0.43–$0.53, which excludes rationalization charges for fiscal 4Q16.
For an ongoing analysis of this sector, please visit Market Realist’s Consumer Discretionary page.
