Total’s Forward Valuation: Peer Comparison
In the previous part of this series, we discussed Total’s historical valuation trends. Now we’ll compare its forward valuation with that of its peers.
Nov. 20 2020, Updated 11:03 a.m. ET

Peer comparison
In the previous part of this series, we discussed Total’s (TOT) historical valuation trends. In this part, we’ll compare TOT’s forward valuations with those of its peers.
Before we proceed with the peer comparison, let’s look at the market caps, or capitalizations, of integrated energy companies. Total’s market cap stands at $106 billion. TOT’s peer ExxonMobil (XOM) has the highest market cap in the peer group, with $337 billion. Chevron (CVX) and Royal Dutch Shell (RDS.A) have market caps of $161 billion and $142 billion, respectively. BP’s (BP) market cap stands at $89 billion. For exposure to integrated energy sector stocks, you could consider the Energy Select Sector SPDR ETF (XLE). The ETF has a 36% exposure to XOM and CVX.
TOT’s forward valuations
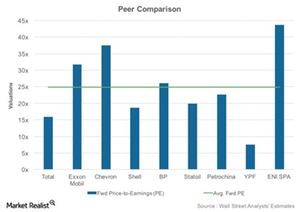
TOT is currently trading at a forward PE (price-to-earnings) ratio of 16x, which is below the average of its peers of 25x. Peers Royal Dutch Shell (RDS.A), Statoil (STO), Petrochina (PTR), and YPF (YPF) are also trading below the average.
The low oil price outlook is pressuring the expected earnings for energy companies and raising their forward PE ratios. According to the EIA (U.S. Energy Information Administration), going forward, oil prices are expected to remain subdued. Both crude oil benchmarks, Brent and WTI (West Texas Intermediate) are trading below $35 per barrel.
Lower oil prices are likely to shrink the EBITDA (earnings before interest, tax, depreciation, and amortization) of energy companies. A fall in EBITDA results in a rise to the EV-to-EBITDA (enterprise value to earnings before interest, tax, depreciation, and amortization) ratio, assuming EV remains constant. Total’s forward EV-to-EBITDA stands at 5.6x. TOT’s peer ExxonMobil (XOM) is currently trading at the forward EV-to-EBITDA of 8.9x. This is higher than forward EV-to-EBITDA of Chevron (CVX), which stands at 6.4x.
