Patterson-UTI Energy Inc
Latest Patterson-UTI Energy Inc News and Updates

Patterson-UTI Energy’s 4Q15 Earnings Beat Wall Street Estimates
Patterson-UTI Energy (PTEN) released its 4Q15 financial results on February 4, 2016. The company recorded total revenues of $338.5 million in 4Q15, down 62% from $901.2 million recorded in 4Q14.

How Does Nabors Industries’ Valuation Compare to Its Peers?
Nabors Industries’ valuation, expressed as a TTM PE (price-to-earnings) multiple, isn’t available due to negative adjusted earnings.

What Do Analysts Expect from Flotek’s 4Q16 Earnings?
In 4Q16, analysts expect Flotek Industries (FTK) to post an adjusted loss per share of ~$0.04.

Correlation between Crude Oil and Halliburton on September 5
The correlation coefficient between the price of crude oil and Halliburton (HAL) stock from September 5, 2016, to September 5, 2017, is 0.65.

Inside Patterson-UTI Energy’s Current Valuation Compared to Peers
Patterson-UTI Energy’s EV, when scaled by trailing-12-month adjusted EBITDA, is lower than the group peer average.

Is Schlumberger’s Stock Price Showing Weakness?
On February 23, 2018, Schlumberger was trading at $66.50, which is ~17% lower than its price a year ago.

Saudi Arabia’s Oil Production Is near a Five-Month High
Saudi Arabia’s crude oil production increased by 60,000 bpd to 10,120,000 bpd in May—compared to the previous month.

How Upstream Operators’ Capex Could Affect NOV’s Margin in 2017
From 4Q15 to 4Q16, National Oilwell Varco’s (NOV) EBITDA margin crashed, dropping from 6.8% to -45.3% during this period.

Superior Energy Services Reacts to Crude Oil’s Price
Superior Energy Services’ (SPN) correlation with crude oil’s price on March 28–June 28 was 0.62—a strong positive relationship.

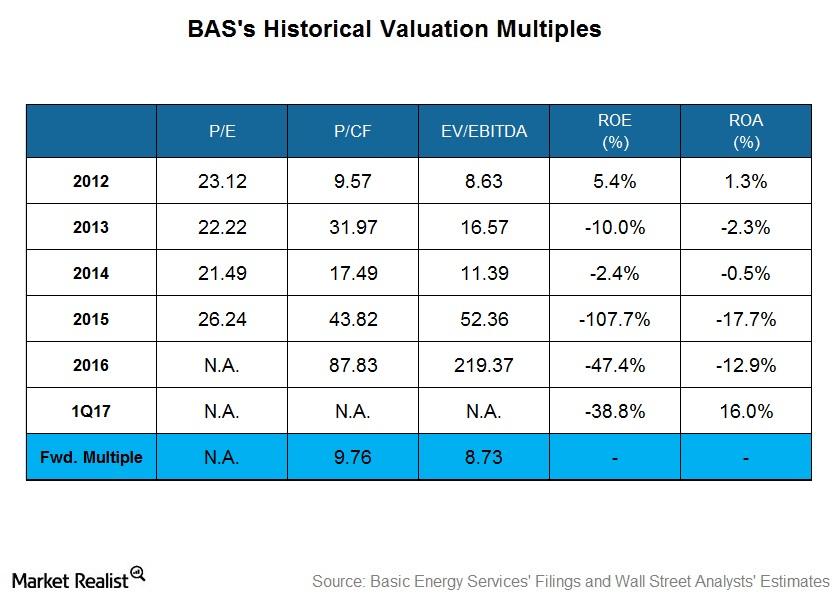
What Does Basic Energy Services’ Historical Valuation Suggest?
On March 31, 2017, Basic Energy Services’ (BAS) stock price had fallen 6% from December 30, 2016.

What Is Patterson-UTI Energy’s Guidance on Its 4Q16 Results?
On January 23, 2017, Patterson-UTI Energy (PTEN) provided an update on its revenues and earnings for 4Q16. PTEN expects its revenues to increase 20% to $247 million in 4Q16, compared to $206.3 million in 3Q16.

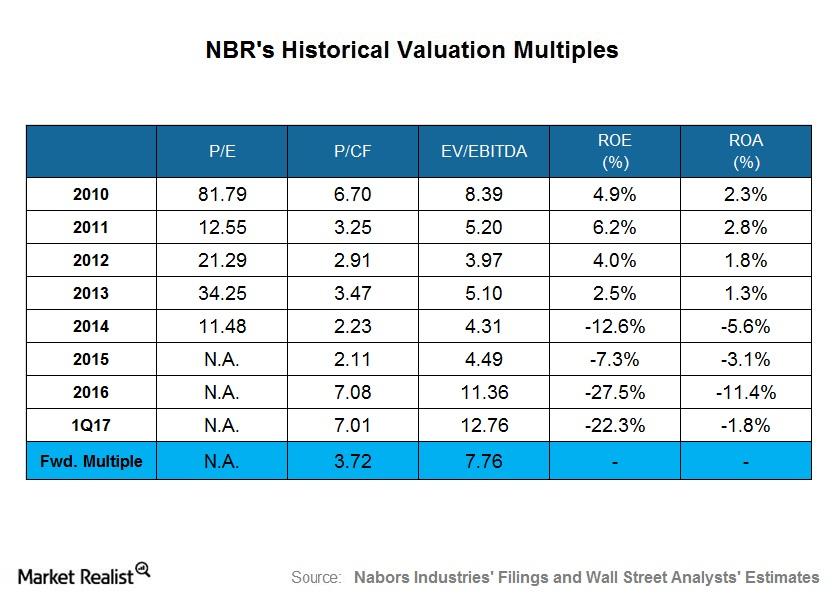
What Nabors Industries’ Historical Valuation Suggests
On March 31, 2017, Nabors Industries (NBR) stock was 20.0% lower than it was on December 30, 2016. In 1Q17, NBR’s adjusted earnings were negative.

What Do Analysts Expect from Tidewater’s Fiscal 3Q17 Earnings?
In fiscal 3Q17, analysts expect an ~$1.16 adjusted loss per share for Tidewater. Analysts expect Tidewater’s adjusted loss to fall in the coming quarter.

How WFT Stock Has Reacted to Crude Oil Prices
Weatherford International (WFT) stock’s correlation with crude oil was strong between June 29 and July 6, at 0.72.

What Could Drive Schlumberger’s Performance in 1Q17 and Beyond?
Schlumberger’s (SLB) Drilling segment witnessed the highest revenue fall of 32% in 4Q16 compared to 3Q16.

How Rig Count and Upstream Operator Capex Affected FTK
From 2Q16 to 2Q17, Flotek Industries’ (FTK) EBITDA margin (or EBITDA as a percentage of revenues) improved to 2.3% from 0.7%.

Analysts’ Recommendations for RES, DRQ, WFT, PTEN, and FTK
Approximately 79% of the Wall Street analysts tracking Patterson-UTI Energy (PTEN) have recommended a “buy” or some equivalent as of May 15.

What Does Patterson-UTI Energy’s Historical Valuation Suggest?
Patterson-UTI Energy’s forward PE multiple isn’t available, which indicates negative earnings in the next 12 months.

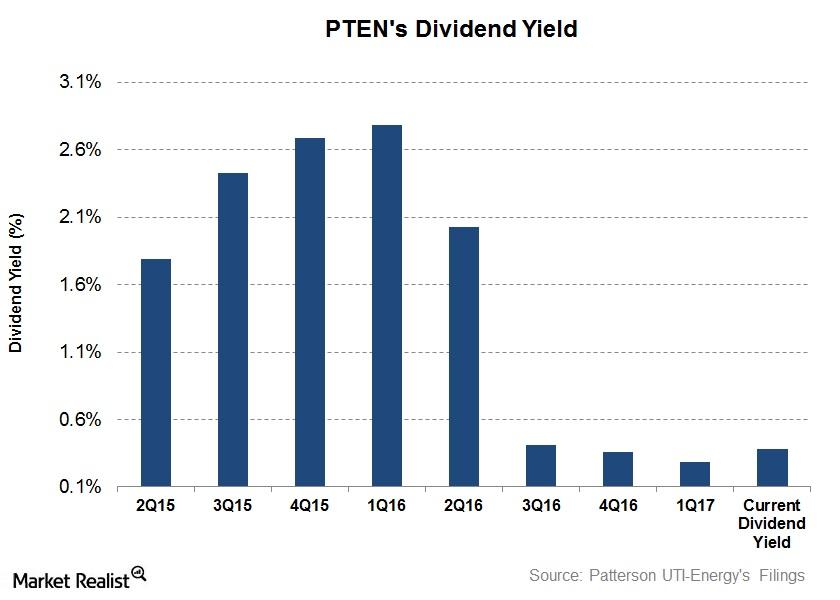
Patterson-UTI Energy’s Dividend Yield on June 2
Patterson-UTI Energy’s (PTEN) dividend yield fell to 0.29% on March 31, 2017. Since then, its dividend yield has risen to 0.38% as of June 2, 2017.

Patterson-UTI Energy Has Risen 87% in 1 Year
In the past year, Patterson-UTI Energy stock has risen 87% as of February 17, 2017. It’s outperformed the VanEck Vectors Oil Services ETF’s return of ~35% in the same period.

National Oilwell Varco’s Correlation with Crude Oil Prices
National Oilwell Varco’s correlation with crude oil prices increased in the trailing year to September 8, 2017—compared to the previous year.

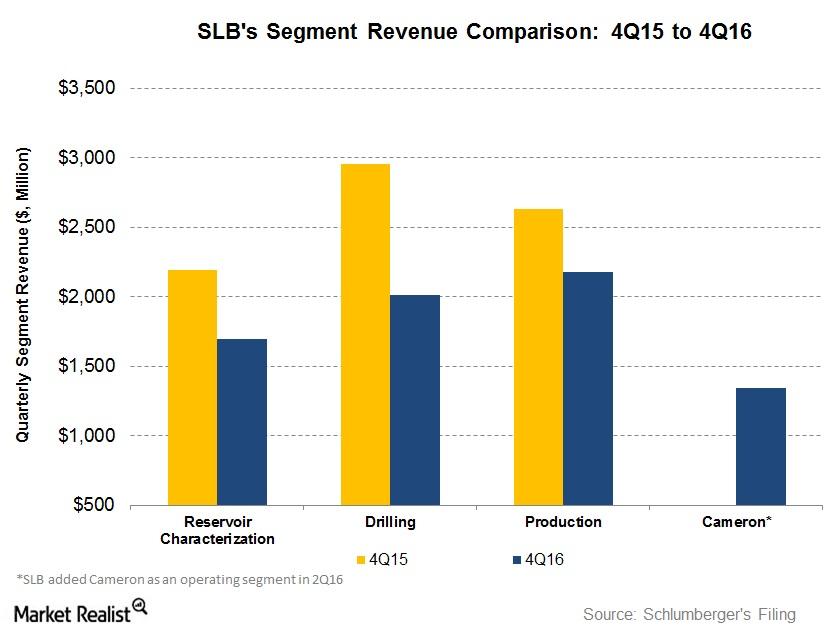
Analyzing the Factors Affecting Schlumberger’s Revenue
Schlumberger’s Drilling segment witnessed the highest revenue fall at 32% in 4Q16 compared to 4Q15. The segment was followed by the Reservoir Characterization and Production segments.

Patterson-UTI Energy in 4Q16: Key Drivers, Then and Now
From 4Q15 to 4Q16, Patterson-UTI’s Contract Drilling segment revenue fell ~33%, while its Pressure Pumping segment witnessed a 20% revenue decline.

Upstream Operators’ Capex and Patterson-UTI Energy’s 2017 Margins
In the past couple of years, some major US upstream and integrated companies have reduced their capex following the sharp fall in crude oil prices.

How Did Schlumberger React to Crude Oil Prices Last Week?
Crude oil prices have risen significantly since the end of June 2017. Analysts don’t expect much impending downside in crude oil prices.

What Do Analysts Expect from WFT’s Q2 2018 Earnings?
Weatherford International (WFT) plans to hold its Q2 earnings call on July 27. Analysts expect an adjusted loss of $0.18 per share for WFT.

Will Upstream Operators’ Capex Impact TechnipFMC in Q2 2018?
In the past year, crude oil has increased ~64%.

Analysts’ Forecast for Superior Energy Services
Approximately 50% of the Wall Street analysts tracking Superior Energy Services rated it as a “buy” or some equivalent as of June 28.

Patterson-UTI Energy’s ‘Buy’ Ratings Are Increasing
On March 19–June 19, the percentage of analysts recommending a “buy” or some equivalent for Patterson-UTI Energy has increased from 76% to 78%.

Top Five Oilfield Equipment and Services Companies
According to Wall Street analysts’ ratings, Halliburton (HAL) has the highest “buy” or some equivalent rating in the OFS industry.

What Schlumberger’s Historical Valuations Suggest
On March 29, Schlumberger’s (SLB) stock price was 4.0% lower than on December 29, 2017.

Schlumberger: Analysts’ Recommendations before 1Q18
As of April 11, 2018, 78% of the analysts tracking Schlumberger rated it as a “buy,” ~19% rated it as a “hold,” and 3% rated it as a “sell.”

What Does Flotek Industries’ Forward Valuation Suggest?
Flotek Industries’ forward EV-to-EBITDA multiple (11.7x) is significantly lower than its current EV-to-EBITDA multiple (~199x).

Patterson-UTI Energy: Management’s Views after 2Q17
Since September 29, Patterson-UTI Energy’s stock price has fallen 2%—compared to a 2% rise in the iShares Core S&P Mid-Cap ETF (IJH).

Energy Stocks: Biggest Gainers on September 4–8
On September 1–8, 2017, oilfield service stock Tidewater (TDW) rose the most among the energy sector stocks.

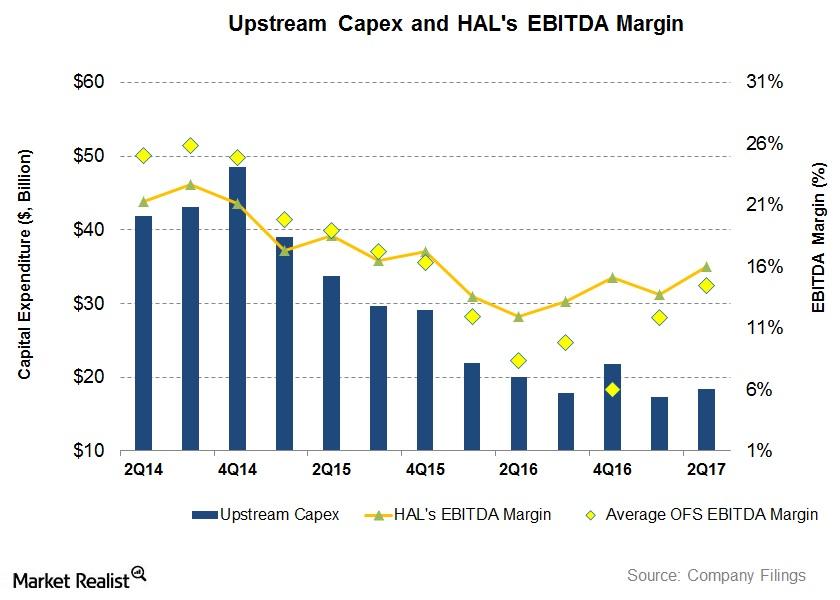
What Halliburton’s Margin Has to Do with Upstream Operators’ Capex
From 2Q16 to 2Q17, Halliburton’s (HAL) EBITDA margin (or EBITDA as a percentage of revenues) rose from 12% to 16%.

Chart in Focus: Schlumberger’s Historical Valuation Multiples
On June 30, 2017, Schlumberger’s (SLB) stock price was 22% lower than its price on December 30, 2016. In 2Q17, SLB’s adjusted earnings were negative.

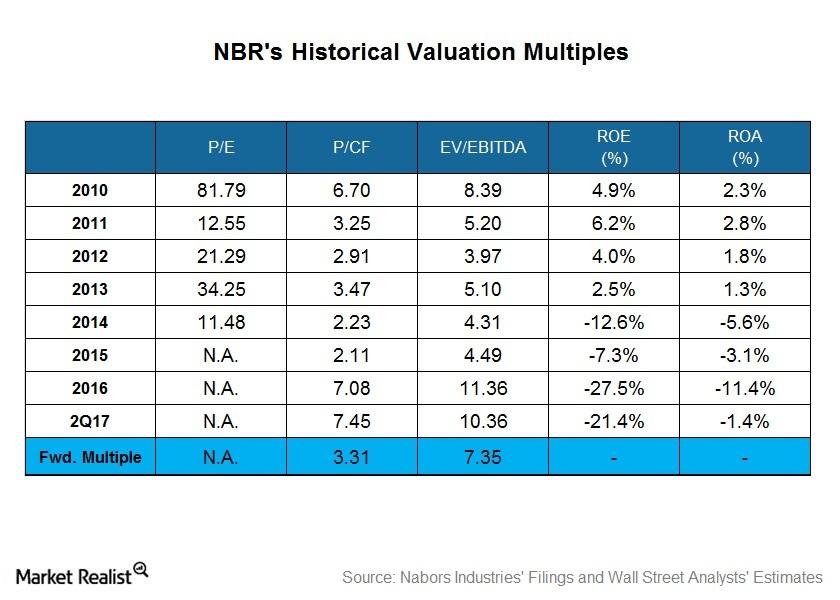
What Does Nabors Industries’ Historical Valuation Suggest?
Nabors Industries’ PE multiple was not meaningful in 2015 and 2016 as a result of negative adjusted earnings during this period.

Correlation between Weatherford and Crude Oil on August 4
Weatherford International (WFT) stock and crude oil prices have had a steady positive correlation in the past year.

What Was the Short Interest in Schlumberger on August 4?
Short interest in Schlumberger’ (SLB) stock as a percentage of its float was ~1.5% on August 4, 2017, compared to 1.6% as of June 30, 2017.

What’s the Outlook for PTEN, BHGE, and BAS?
Since the beginning of 2017, Patterson-UTI Energy (PTEN) stock has returned -28% as of August 1.

How Patterson-UTI Energy’s Management Sees 2Q17
PTEN’s management believes that its merger with Seventy Seven Energy has consolidated PTEN’s position in drilling and pressure pumping activity.

How Upstream Operators’ Capex Cuts Could Affect Halliburton
From 1Q16 to 1Q17, Halliburton’s (HAL) EBITDA margin remained nearly unchanged at 13.7%.

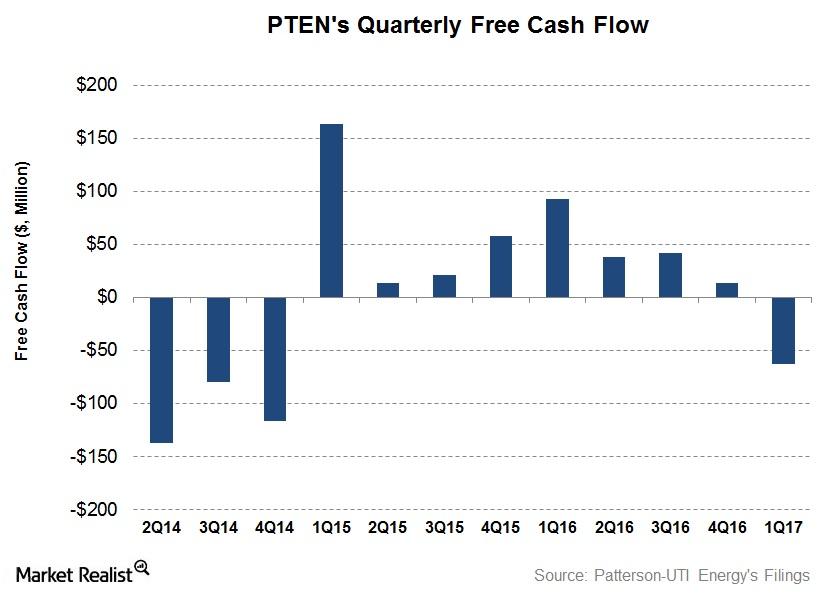
A Look at Patterson-UTI Energy’s Higher 2017 Capex Plan
Patterson-UTI Energy’s capex budget for 2017 is $450.0 million. That’s 275.0% higher than its 2016 capex.

Can Upstream Operators’ Capex Affect PTEN’s Margin in 2017?
Some of the major US upstream and integrated companies have gradually reduced their capex following crude oil’s sharp price fall since mid-2014.

Management’s Views on Patterson-UTI Energy after 1Q17
In 2Q17, management expects Patterson-UTI Energy (PTEN) to operate 84 rigs under term contracts, compared to 81 in 1Q17.

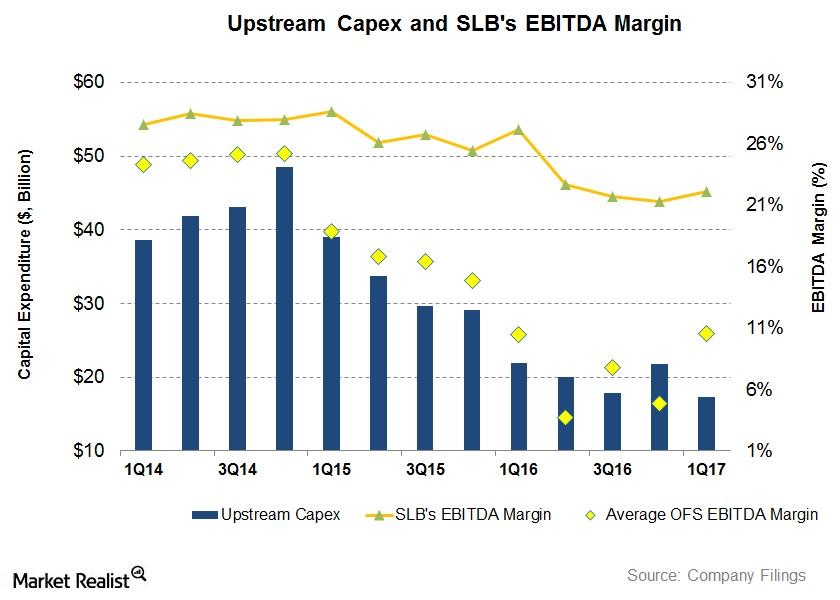
Upstream Operators’ Capex Could Impact Schlumberger’s Margin
Schlumberger’s EBITDA margin was impacted negatively as upstream companies slashed their budgets. From 1Q16 to 1Q17, Schlumberger’s EBITDA margin fell.

Understanding Patterson-UTI’s Management Vision for 2017
Patterson-UTI’s (PTEN) management believes that 2017 will see positive momentum for the company, led by higher drilling and pressure pumping activity.

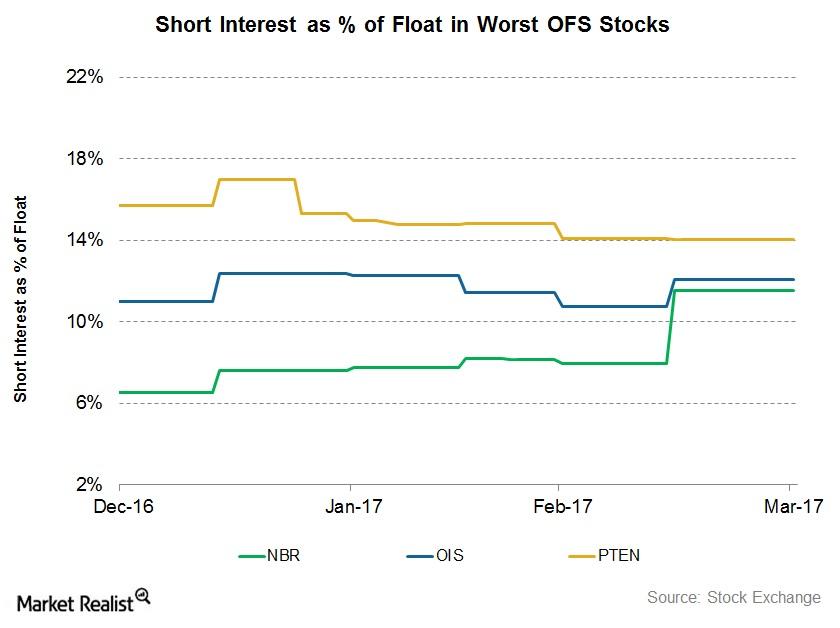
Short Interest: OFS Stocks with the Lowest Returns in 1Q17
Short interest in Nabors Industries (NBR), as a percentage of its float, rose to 11.5% as of March 31, 2017—compared to 6.5% as of December 30, 2016.

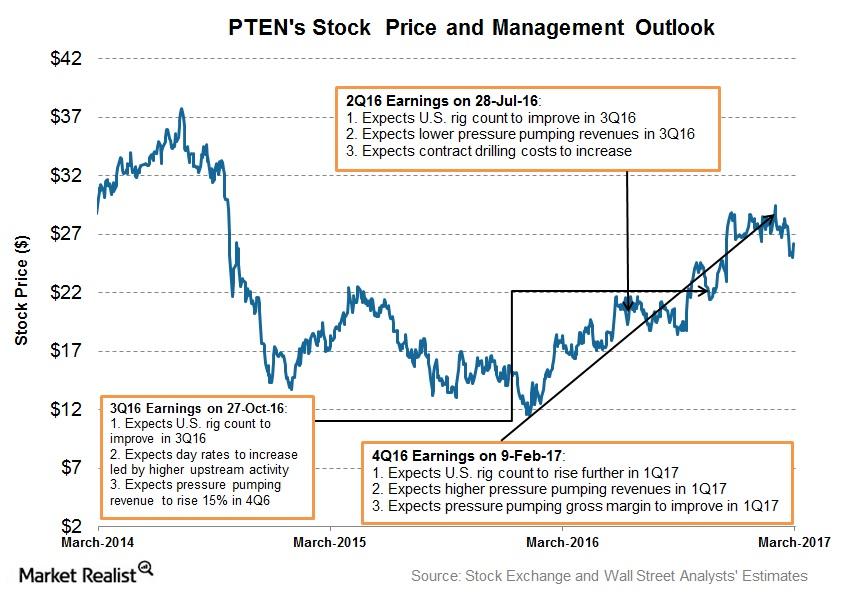
Patterson-UTI Energy’s Forecasts for 2017
Patterson-UTI Energy’s (PTEN) operated average US rig count is expected to rise 21.0% in 1Q17 compared to 4Q16.

Will Upstream Operators’ Spending Affect HAL’s Margin in 2017?
In the past couple of years, some major US upstream and integrated companies have reduced their capital expenditures (capex) following crude oil’s sharp price fall.

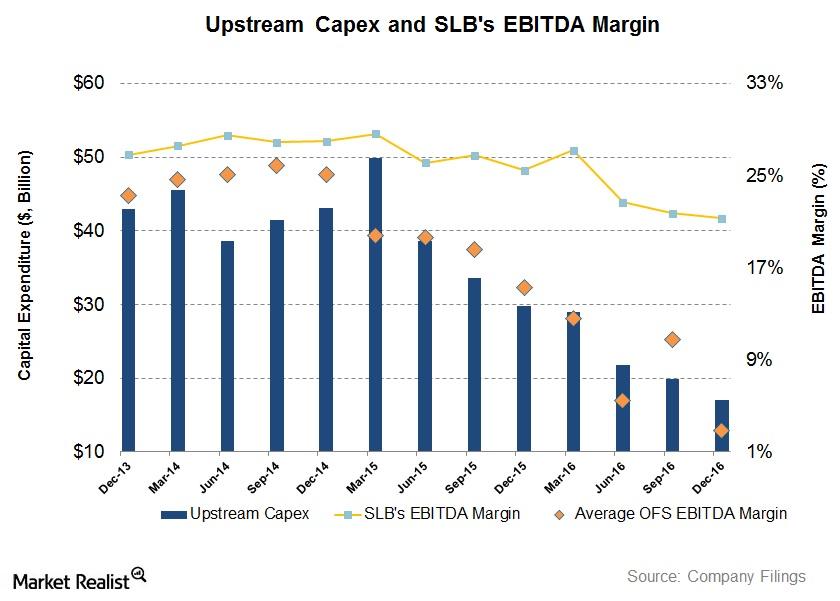
Will Upstream Operators’ Capexes Affect SLB’s 1Q17 Margin?
In the past couple of years, some major US upstream and integrated companies have reduced their capital expenditures (capex) following crude oil’s sharp fall.

Has Short Interest in PTEN Decreased since 3Q16?
Short interest in Patterson-UTI Energy (PTEN) stock as a percentage of its float was 15.7% on January 23, 2017, compared to 17.9% on September 30, 2016.

Are Analysts Changing Their Recommendations on Flotek Industries?
Wall Street’s recommendations on Flotek Industries In this article, we’ll look at changes in Wall Street analysts’ recommendations for Flotek Industries (FTK) between September and December. Consensus rating for Flotek Industries In December so far, 100% of the analysts tracking Flotek Industries have rated it a “buy” or some equivalent. In comparison, approximately 83% of […]

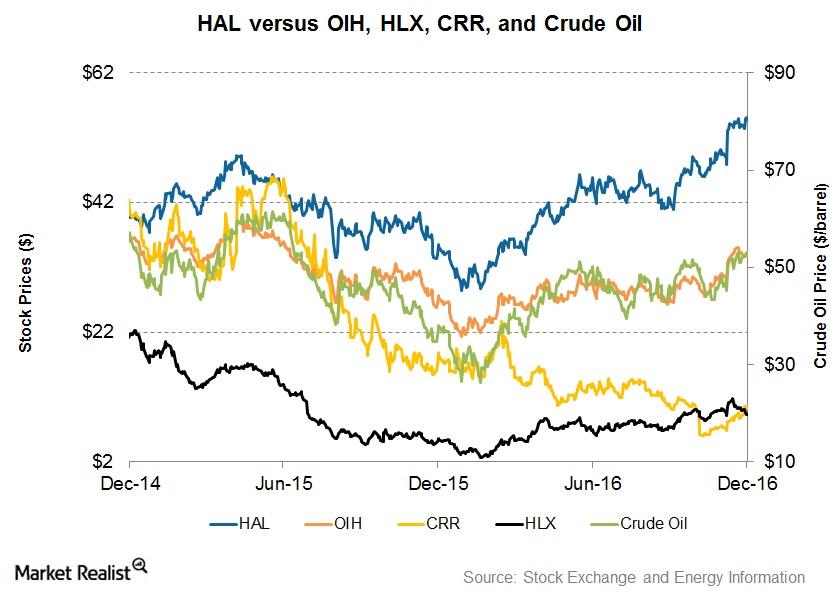
Analyzing Halliburton’s Stock Price Returns
From December 2014 to December 2016, Halliburton’s (HAL) stock price reached the highest level in December 2016. It troughed at ~$28 in January 2016.

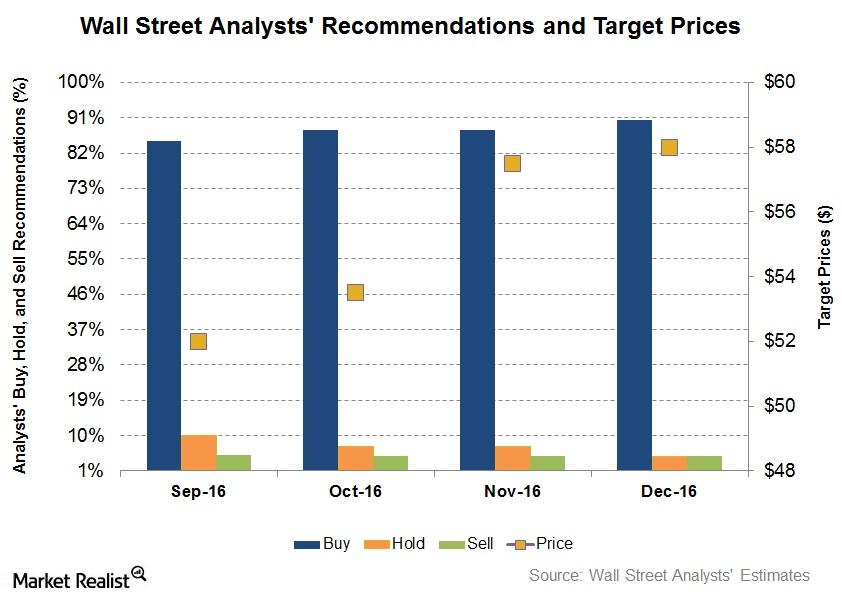
Are Analysts Changing Recommendations for Halliburton?
In December so far, 90% of the analysts tracking Halliburton rated it a “buy” or some equivalent.

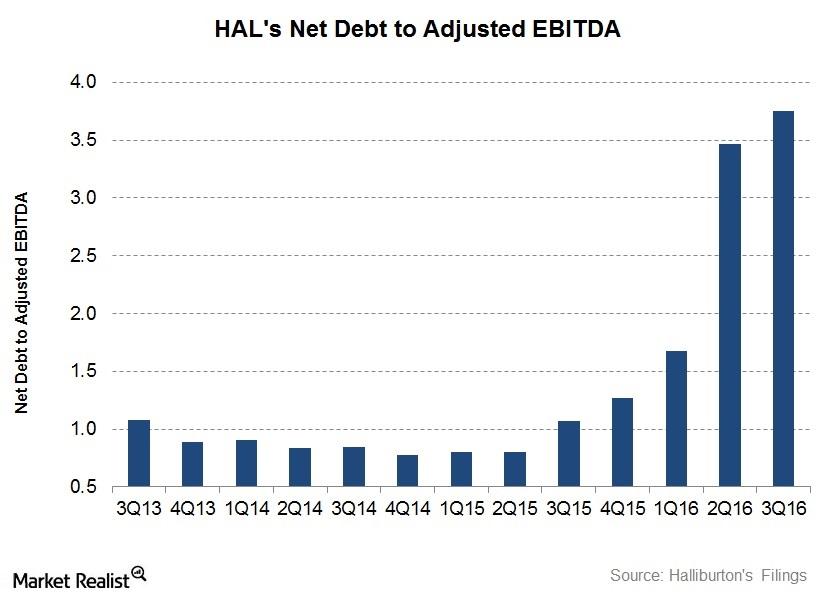
Is Halliburton’s Indebtedness on the Rise?
In 3Q16, Halliburton’s net-debt-to-adjusted-EBITDA multiple was ~3.8x, or 251% higher than it was a year ago.

PTEN Plans to Acquire Seventy Seven Energy
On December 12, Patterson-UTI Energy, one of the prominent contract drillers in North America, disclosed that it agreed to acquire Seventy Seven Energy.

Analyzing Indebtedness: PTEN versus HP
We’ll discuss Helmerich & Payne (HP) and Patterson-UTI Energy’s (PTEN) indebtedness. On September 30, Patterson-UTI Energy’s net debt was $576 million.

Why October Eagle Ford Natural Gas Production Fell 18% in a Year
The EIA estimates that natural gas production at the Eagle Ford Shale was ~5.9 Bcf (billion cubic feet) per day in October 2016.

Has HP’s Correlation with Crude Oil Decreased since Fiscal 3Q16?
The correlation coefficient between Helmerich & Payne’s stock price and crude oil prices from November 2015 to the present is 0.67.

How Is Helmerich & Payne’s Order Backlog Looking?
On June 30, 2016, Helmerich & Payne (HP) had an order backlog of ~$2.0 billion compared to ~$3.5 billion in the previous year.

What’s Schlumberger’s Implied Volatility?
Since Schlumberger’s 2Q16 financial results were announced on July 21, 2016, its implied volatility fell from 22.6% to its current level.

How Volatile Is FMC Technologies?
On August 30, 2016, FMC Technologies (FTI) had an implied volatility of ~33%.

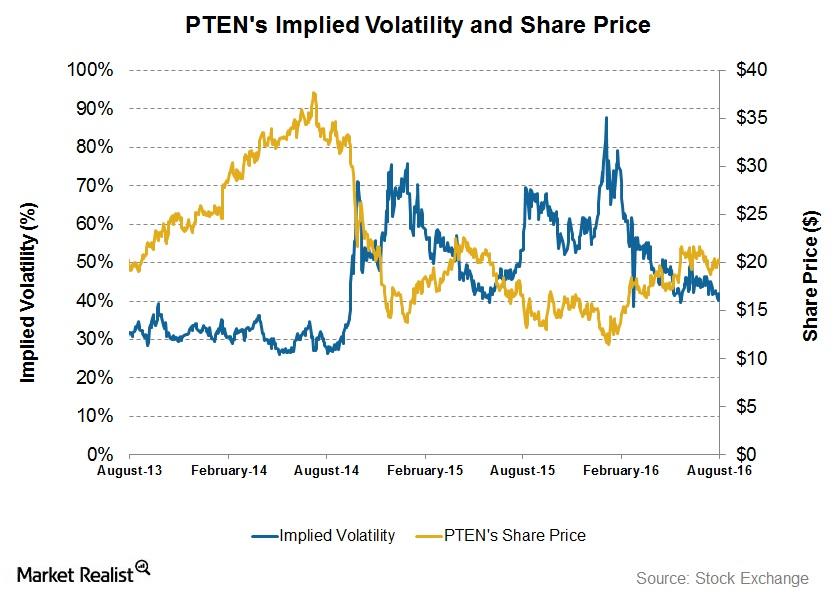
How Volatile Is Patterson-UTI Energy after 2Q16?
On August 19, Patterson-UTI Energy had an implied volatility of ~40%. Since its 2Q16 results were announced, its implied volatility has fallen from ~45%.

Has Patterson-UTI Energy’s Correlation with Crude Oil Increased since Fiscal 2Q16?
The correlation coefficient between Patterson-UTI Energy’s stock price and crude oil from August 2015 to now is 0.64, indicating a positive relationship.

Can New Amendments Extend Patterson-UTI Energy’s Credit Commitment?
Patterson-UTI Energy’s net debt-to-EBITDA Patterson-UTI Energy’s (PTEN) net debt-to-TTM (trailing-12-month) EBITDA (earnings before interest, tax, depreciation, and amortization) trended upward from fiscal 2Q15 through fiscal 2Q16. In 2Q16, Patterson-UTI Energy’s net debt-to-EBITDA was 2.7x, or 208% higher than one year previously. Remember, net debt-to-EBITDA reflects how easily a company can repay its debts from its […]

How Much Will Rig Count Affect Patterson-UTI Energy in Fiscal 3Q16?
In 2Q16, the US rig count declined by 51% over one year previously. During this period, the international rig count decreased by only 19%.

How Far Could US Shale Oil Production Drop?
The EIA (U.S. Energy Information Administration) expects crude oil production to slow down at the key US shales.

Inside the Analyst Forecasts for Patterson-UTI Energy after Its 2Q16 Earnings
Approximately 52% of analysts tracking Patterson-UTI Energy (PTEN) rated it a “buy” or some equivalent. Approximately 34% rated the company a “hold.”

Has PTEN’s Correlation with Crude Oil Decreased since 1Q16?
PTEN’s correlation with crude oil price has increased marginally since the end of 1Q16 through July 8, 2016, compared to the past year.

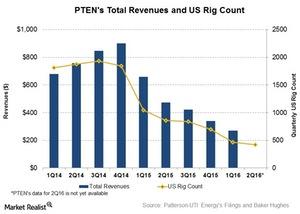
Will Rig Count Affect Patterson-UTI Energy in 2Q16?
In 1Q16, the US rig count declined by 56% over 1Q15. During this period, the international rig count decreased by only 21%.

Patterson-UTI Energy’s Strategy: Will It Outperform the Industry?
OFS (oilfield service) companies such as Patterson-UTI Energy (PTEN) are affected by rig counts and energy prices.

What Does Patterson-UTI Energy’s Current Valuation Imply?
Patterson-UTI Energy’s (PTEN) adjusted earnings were negative in fiscal 1Q16.

Could Patterson-UTI Energy Violate Debt Covenants in 2Q16?
As of March 31, 2016, Patterson-UTI Energy had a $65 million debt under a senior unsecured term loan.

Utica Shale Natural Gas Production Soared in March, and Here’s Why
According to the EIA, the Utica Shale in eastern Ohio has become one of the fastest-growing natural gas producing regions in the United States.

Which OFS Companies Are Correlated to Crude Oil Prices?
OFS companies are impacted by rig counts and energy prices. In the past year, WTI crude oil prices fell ~12%. Crude oil prices have fallen since June 2014.

How Did Diamond Offshore Drilling’s Share Price React to Earnings?
Diamond Offshore Drilling released its financial information for fiscal 4Q15 on February 8, 2016. Its stock reacted somewhat positively immediately following the earnings release.

PTEN is Confident despite Energy Market Uncertainty
Patterson-UTI Energy’s segment wise performance From 4Q14 to 4Q15, all of Patterson-UTI Energy’s (PTEN) segments saw lower revenues. The Pressure Pumping segment suffered the highest revenue decline of 67% while the Contract Drilling segment was relatively resilient with a 59% fall. These two segments accounted for 99% of PTEN’s 4Q15 revenues. With respect to operating […]