L Brands Inc
Latest L Brands Inc News and Updates

Comparing L Brands’ PE Multiple with Peers’
On January 8, L Brands’ (LB) 12-month forward PE ratio was 10.4x.

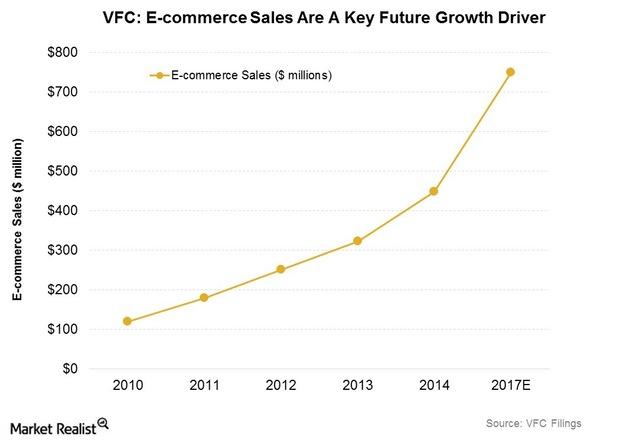
Will VF Corporation’s Vans Brand Spur Higher Growth in 3Q15?
VF Corporation saw sales of $2.5 billion in 2Q15, up 4.7% year-over-year. Its performance was boosted by top brands The North Face, Timberland, and Vans.

Nike’s Fastest-Growing Demographic Segments
The women and young athletes demographic segments saw the greatest sales traction in fiscal 2015 for Nike.

September Winners in US Domestic Moats: Discretionary, Financials
Moat company Polaris Industries (PII) has been doing well this year, returning ~30.0% year-to-date as of October 23, 2017.

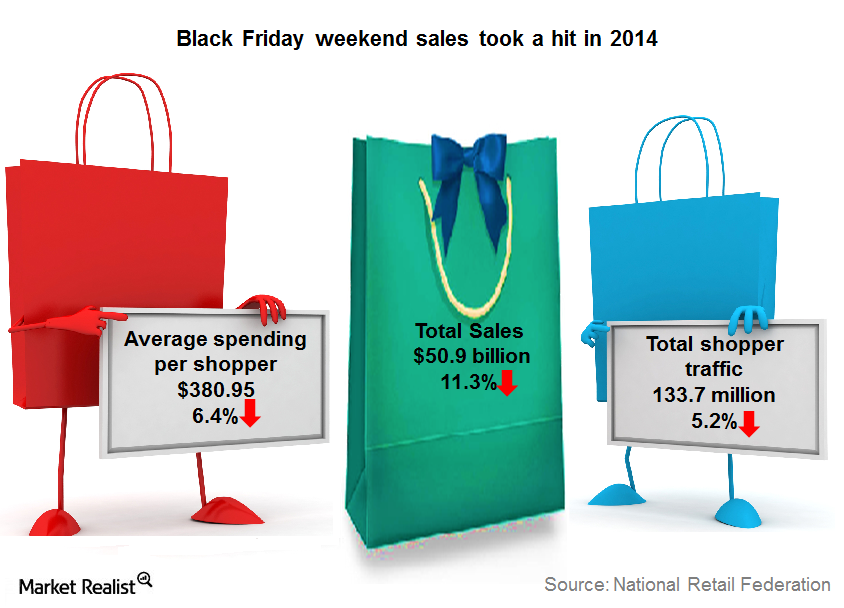
Santa Could Yet Bring Cheer To Holiday Retail Sales
We think the final tally for holiday retail sales could differ from the gloomy picture some of the initial estimates had painted.

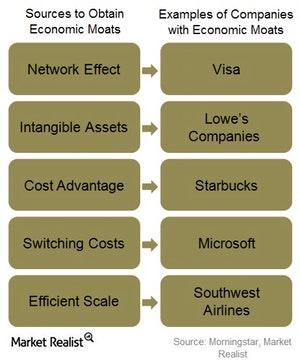
The Idea behind Economic Moats
“How Moats Translate into Sustainable Competitive Advantages” is a five-part moat investing education series that explores the primary sources of economic moats. she

U.S. Moat Index: Analyzing Its Performance in April
TransDigm Group (TDG) rose 12% in April. Two other additions, Cerner and Guidewire Software, added to the U.S. Moat Index’s performance in April.

Sycamore-Victoria’s Secret Deal in Jeopardy, L Brands Falls
On Wednesday, L Brands received notice from Sycamore Partners that it plans to terminate the deal to buy Victoria’s Secret.

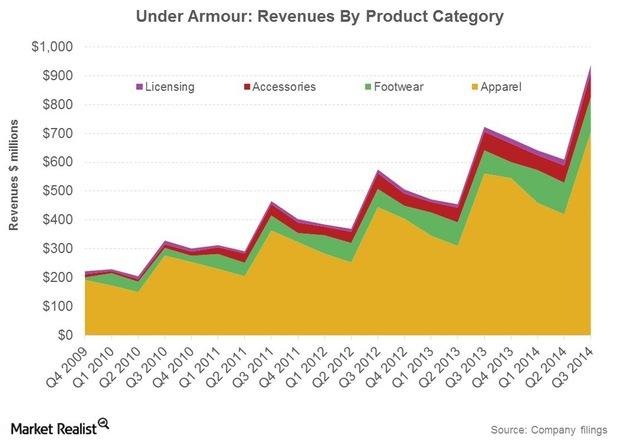
Under Armour: The Nature Of Its Business, Product Portfolio
UA’s product, marketing, and sales teams each play an active role in the design process. This collaboration helps control brand and product consistency.

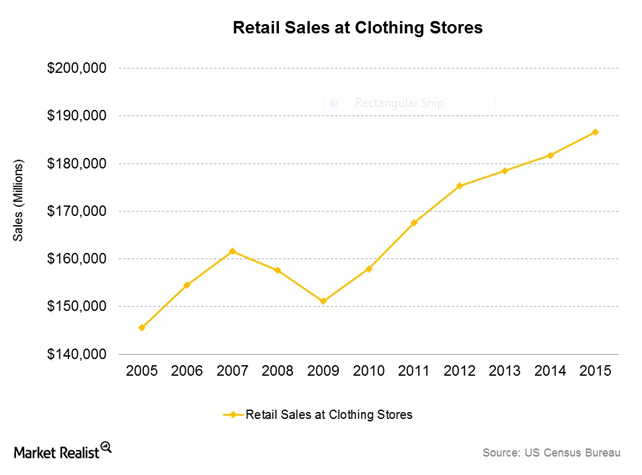
How Has Athleisurewear Boom Impacted the US Apparel Industry?
The growth rate in activewear or athleisurewear has outpaced the overall clothing market, with a double-digit CAGR over the past five years.

Gap Stock Slumps on Guidance Cut, CEO Exit
Gap stock fell about 6% in after-hours following management’s guidance cut. The company also announced the exit of CEO Art Peck.

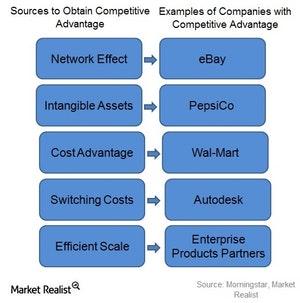
What Are the Sources to Obtain Economic Moats?
“How Moats Translate into Sustainable Competitive Advantages” is a five-part moat investing education series that explores the primary sources of economic moats. The idea of an economic moat refers to how likely a company is to keep competitors at bay for an extended period. According to Morningstar Equity Research, there are five key attributes that […]

L Brands Stock Fell on Poor Q4 Sales, Weak Outlook
L Brands (LB) stock was down 4.6% today as the company missed analysts’ sales expectations for the fourth quarter of fiscal 2018, which ended on February 2, 2019.

L Brands Down 4.4% after Holiday Sales Data and Target Price Cuts
On January 10, L Brands (LB) reported sales of $2.48 billion for the five weeks ended January 5.

Why Has L Brands Stock Fallen 8.2%?
On January 10, L Brands stock fell 8.2% as of 9:58 AM EST following the announcement of its sales data for the five weeks ending January 5.

A Look at L Brands’ Margin and Bottom-Line Expectations
For the first three quarters of 2018, L Brands’ (LB) gross margin contracted by 240 basis points to 35.0% due to the lower gross margin at Victoria’s Secret.

L Brands Stock Has Had a Disappointing Run in 2018
Intimate apparel retailer L Brands has had a tough year. Its stock has shed 51.8% of its value as of December 18.

L Brands Found a Buyer for La Senza
On December 13, L Brands announced that it will transfer ownership and control of its entire La Senza business to Regent LP.

Why L Brands Plunged 17.7% on Tuesday
L Brands (LB) reported third-quarter results on November 19.

How Has L Brands Stock Performed This Year?
As of November 15, L Brands’ (LB) stock price is down 40.7% on a YTD basis to $35.69.

L Brands Gets a Rating Upgrade from Wells Fargo
Wells Fargo upgraded L Brands to “outperform” from “market perform” on November 12. L Brands stock closed 1.4% higher on November 12.

Apparel Retailers Have Delivered Strong Top Line Growth
Abercrombie & Fitch (ANF) delivered YoY (year-over-year) sales growth in both the first and second quarters of fiscal 2018.

Strength in the Beauty Business Drives L Brands’ 2Q Top Line
L Brands (LB) reported financial results for the second quarter of 2018 on August 22.

This Is Why L Brands Stock Is Falling Today
Victoria’s Secret owner L Brands (LB) stock is sliding after management revised its 1Q18 profit expectations along with its monthly sales report earlier today.

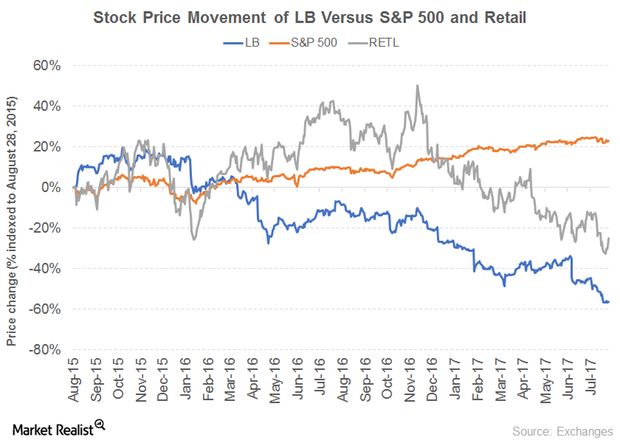
Here’s Why L Brands’ Dividend Yield Is Rising
Reasons behind L Brands’ growing yield Specialty fashion retailer L Brands (LB) saw its sales slow between 2013 and 2016. The company recorded revenue growth of 3.5% in 2016, compared with 6% in 2015. The growth was driven by the Victoria’s Secret and Bath & Body Works segments. Whereas its operating income grew 12% in 2015, it […]

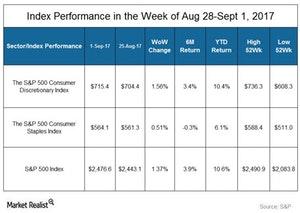
Analyzing the Consumer Sector’s Performance Last Week
On September 1, General Motors (GM) released its August sales report. In August, US retail sales recorded 275,552 vehicles—7.5% higher YoY.

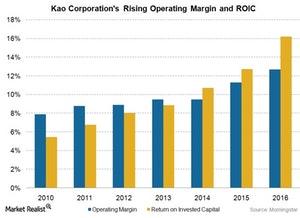
Kao Corporation: What’s Sharpening Its Competitive Edge?
Kao Corporation has become the largest branded and packaged goods company in Japan and the second-largest company in the cosmetics category.

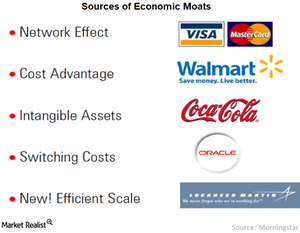
How to Identify Economic Moats
In this series, we’ll discuss how intangible assets can create long-term competitive advantages for companies.

Hanesbrands Declared a Dividend of $0.15 per Share
Hanesbrands reported fiscal 3Q16 net sales of $1.8 billion—a rise of 10.7% compared to net sales of $1.6 billion reported in fiscal 3Q15.

Inside the Vanguard PRIMECAP Fund Portfolio
VPMCX counts information technology, healthcare, and industrials as its core invested sectors. These three sectors make up a combined 80% of the portfolio.

Fidelity Series All-Sector Equity Fund’s YTD 2016 Sector Composition
The Fidelity Series All-Sector Equity Fund (FSAEX) is quite diversified, and it has no dominant sector.

Inside the Portfolio Changes in the Vanguard PRIMECAP Fund in 2016
Vanguard PRIMECAP Fund’s assets were invested across 131 stocks as of June 2016, and it was managing assets worth $44.9 billion as of the end of June.

HanesBrands Acquired Pacific Brands for ~$800 Million
HanesBrands fell by 0.56% to close at $26.55 per share on July 15. Its weekly, monthly, and YTD price movements were 1.1%, 1.7%, and -9.0%, respectively.

HanesBrands Acquires Champion Europe
HanesBrands (HBI) has a market cap of $9.5 billion. Its stock fell by 4.5% to close at $25.13 per share on June 30, 2016.

Moody’s Rated HanesBrands’ Credit Facilities as ‘Baa2’
HanesBrands reported fiscal 1Q16 net sales of $1.22 billion—a rise of 0.84% compared to net sales of $1.21 billion in fiscal 1Q15.
Chief Causes for the Ivy Global Growth Fund’s Poor Showing in YTD 2016
The Ivy Global Growth Fund – Class A (IVINX) figures among the bottom two funds in its peer group of 12 for YTD 2016.

Exploring Portfolio Changes in FSAEX
FSAEX invests primarily in common stocks of US and foreign issuers. It invests in growth stocks, value stocks, or both.

HanesBrands’ Acquisition of Champion Europe: So What?
HanesBrands rose by 2.8% to close at $27.87 per share on April 7, bringing its weekly, monthly, and YTD price movements to -1.7%, -2.6%, and -4.9%.

What Are the Concerns regarding Junk Bonds?
Junk bonds have been in the news due to concerns about defaults. They have an iffy repayment ability even if they’re at the higher end of the rating scale.

North America Is Nike’s Most Significant Growth Driver
North America is Nike’s (NKE) largest segment and biggest contributor to profits. The segment saw the highest growth in absolute terms in fiscal 2Q16.

October Saw Generous Inflows for High-Yield Bond Funds
According to Lipper, net inflows for high-yield bond funds totaled $7.6 billion through October 28, compared to outflows totaling $1.9 billion in September.

First Data Issued the Most Junk Bonds in the Week to October 30
First Data (FDC) issued junk bonds worth $3.4 billion last week. The senior notes were rated Caa1/B and carried a coupon of 7.0%.

What Companies are CBL & Associates’ Top Tenants?
CBL’s top tenants include several big brands, which contributed around 20% of the company’s total revenue in 2014.

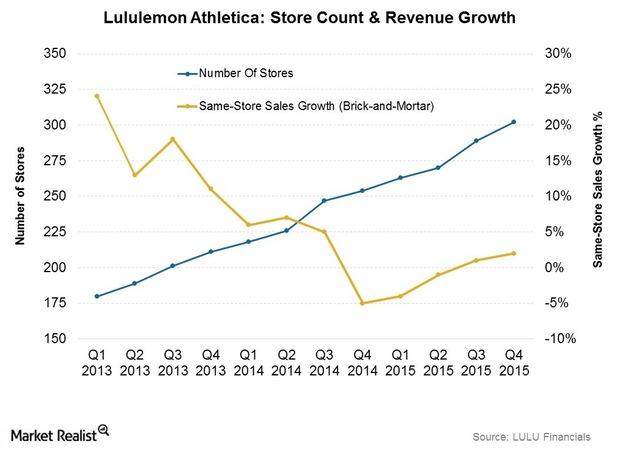
Why Store Expansion is a Critical Driver for Lululemon Athletica
Despite having negative comps in 1H15, Lululemon’s revenue growth for its physical stores was positive at 9.7% year-over-year in fiscal 2015.

Have Same-Store Sales for Lululemon Athletica Turned a Corner?
Lululemon reported a 6% increase in total same-store sales in 4Q15. Same-store sales for its brick-and-mortar stores grew 2% in the quarter.

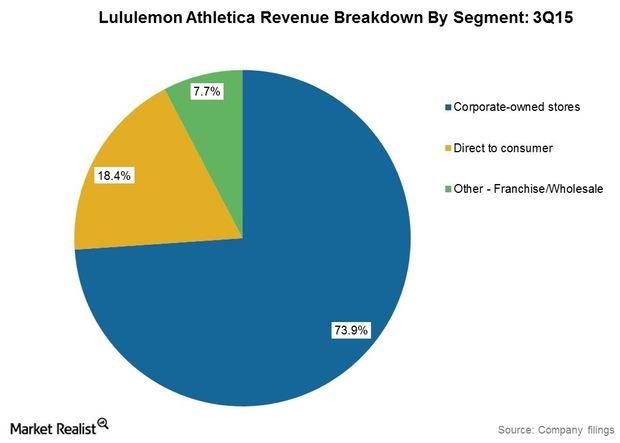
Headwinds And Tailwinds For Lululemon Revenues This Year
Lululemon Athletica announced an increase of 10.4% in its revenues to $419.4 million in the third quarter of fiscal 2015 compared to $379.9 million in 3Q14.

Overview: Lululemon’s Target Market And Product Assortment
Major product lines include fitness pants, shorts, tops and jackets. It also has a range of fitness-related accessories like bags, socks, and yoga mats.