iShares Core S&P Total US Stock Mkt
Latest iShares Core S&P Total US Stock Mkt News and Updates
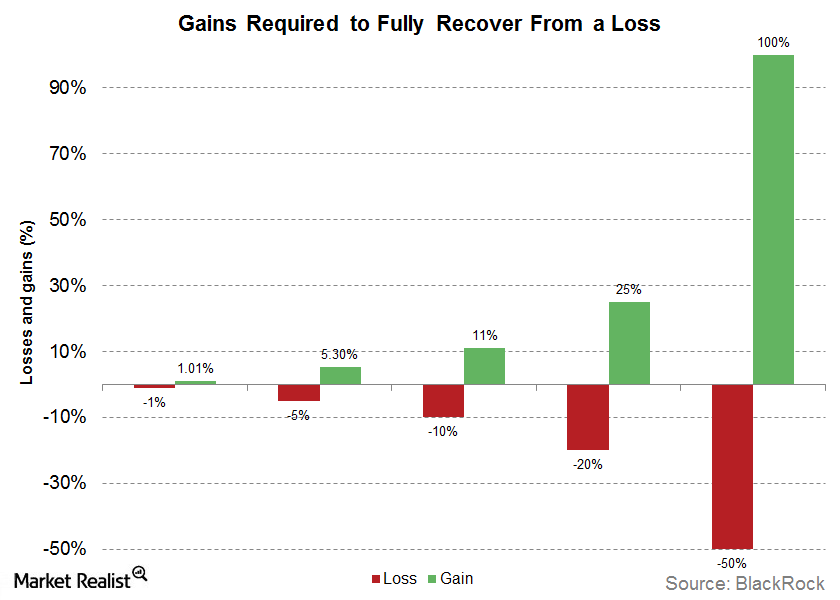
How You Can Win More By Losing Less
Most investors focus much of their time on picking assets that have the potential to win. However, limiting downside risk is just as important.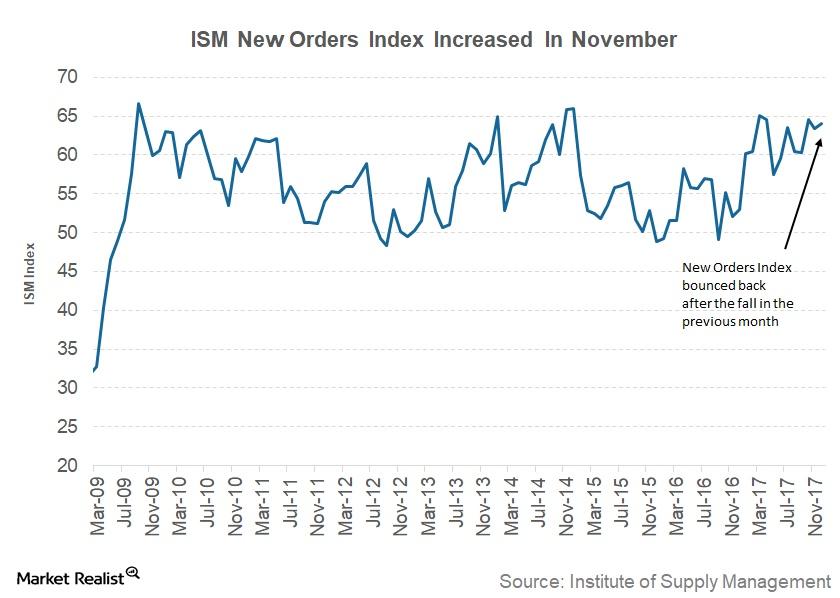
Analyzing the Institute of Supply Management’s New Orders Index
The Institute of Supply Management’s New Orders Index The ISM’s (Institute of Supply Management) New Orders Index is a monthly report on changes in new orders, supplier deliveries, inventories, production, and employment. New orders are a measure of future activity in any industry (VIS), as companies’ production depends on incoming orders. The ISM’s New Orders […]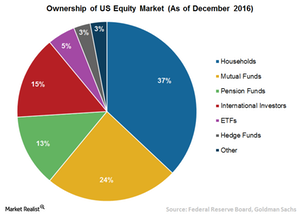
Jury Hasn’t Decided on ETFs’ Role in Stock Market Rise
Although ETF (VTV) ownership increased substantially during the last 20 years, it still isn’t high enough to meaningfully impact stock prices.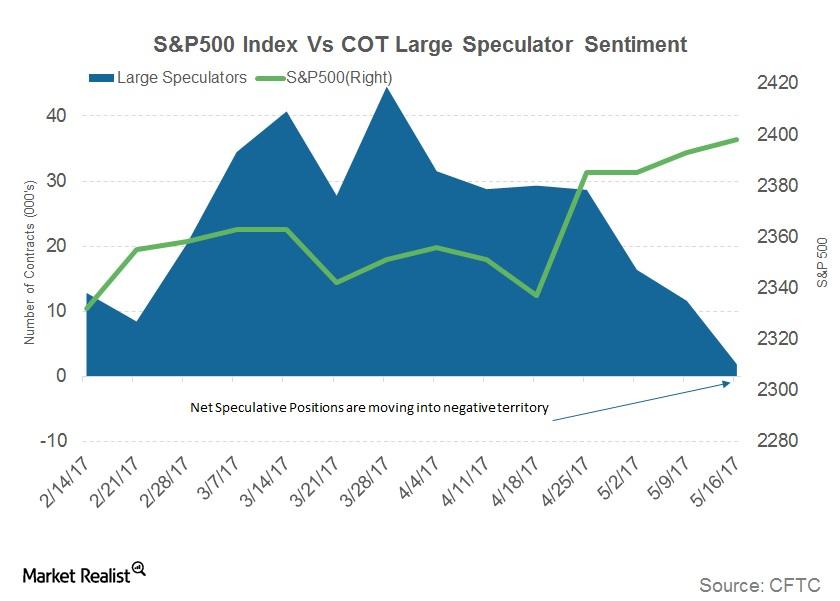
Why S&P 500 Speculative Bets Are off the Table
CFTC data released on Friday indicated that commercial traders maintained a net position of 5,756 contracts in the previous week.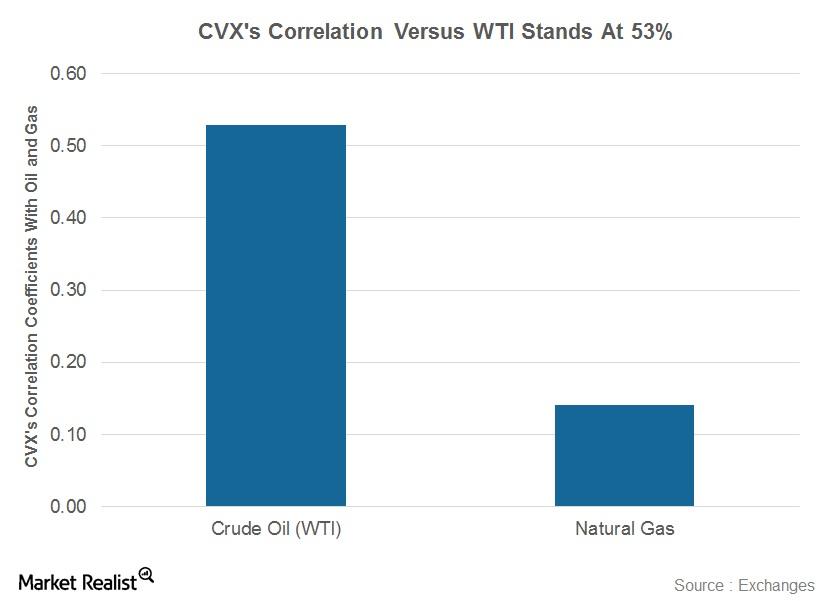
How Does Chevron’s Stock Correlate with Oil Prices?
Correlation coefficient In this series, we’ve analyzed Chevron’s (CVX) Mafumeira Sul project, stock movement, dividend yield, PEG (price-to-earnings-to-growth), ratio, beta, short interest, implied volatility, institutional holdings, and valuation. In this part, we’ll see how Chevron’s stock correlates with oil prices. The correlation coefficient shows the relationship between two variables. A correlation coefficient value of zero […]
Why Janus Thinks Ignoring Inflation Is a Mistake
In this series, we’ll look at the Janus Asset Allocation team’s views on inflation, policy measures, and asset allocation (ITOT) (NEAR), given its assertion that inflation pressures are building.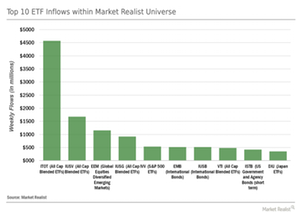
Category Flows: ETF Construction Matters!
The iShares Core S&P Total U.S. Stock Market ETF (ITOT) saw by far the largest inflows within our ETF universe last week.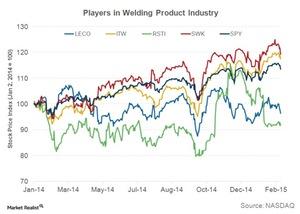
Has Lincoln Electric Outperformed Its Peers?
For fiscal 2015, Lincoln Electric (LECO) successfully gave back $486 million to its shareholders.
Why Quality of Life Is the New Money for Millennials
I believe that consumption demand patterns among millennials, including an emphasis on quality of life, is somewhat influencing this demand for travel and leisure, tech products and personal services.