Goodyear Tire & Rubber Co.
Latest Goodyear Tire & Rubber Co. News and Updates

Is There a Rubber and Tire Shortage? Here's What Top Companies Think
Many consumers are worried about a rubber shortage, and by its extension tires. Is there going to be a shortage?
Goodyear and Cooper Tire Announce Mega Merger, Deal Looks Solid
On Feb. 22, Goodyear announced on that it's acquiring Cooper Tire. The Goodyear-Cooper merger will create a tire behemoth.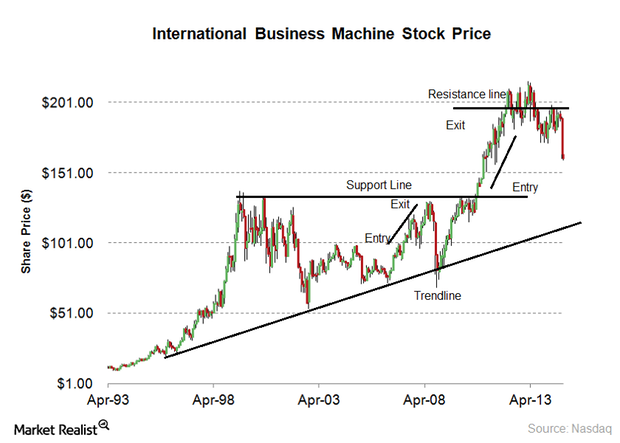
Must-know: A glossary of technical analysis terms
In technical analysis, there’s a series of common terms. Understanding the glossary of technical analysis terms is helpful for investors. Technical analysis is used to predict stock prices. It uses price, time, and volume data.Financials Why it’s important to understand the Dow Theory
The Dow Theory assumes that when a stock market is entering an uptrend or downtrend, the financial markets should agree with each other.Financials Why is the Elliott Wave Theory important in technical analysis?
In the last part of this series, we provided an overview of the Elliott Wave Theory. In this part of the series, we’ll discuss the psychology behind the Elliott Wave Theory’s two phases.Financials Interpreting volume in technical analysis
In technical analysis, volume measures the number of a stock’s shares that are traded on a stock exchange in a day or a period of time. Volume is important because it confirms trend directions.Financials Technical analysis – technical indicators, Dow Theory, and Elliott Wave Theory
We’ll discuss the importance and use of these technical indicators. These indicators are useful in determining trends and making informed decisions.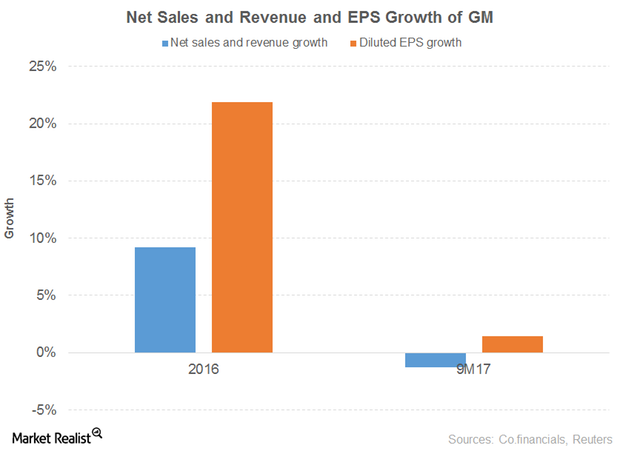
A Look at GM’s Stock Performance
In this part of our focus on the top 18 cheap S&P 500 stocks, we’ll discuss another six stocks: General Motors (GM), Ford Motor (F), Owens-Illinois (OI), The Goodyear Tire & Rubber Company (GT), Navient (NAVI), and Brighthouse Financial (BHF).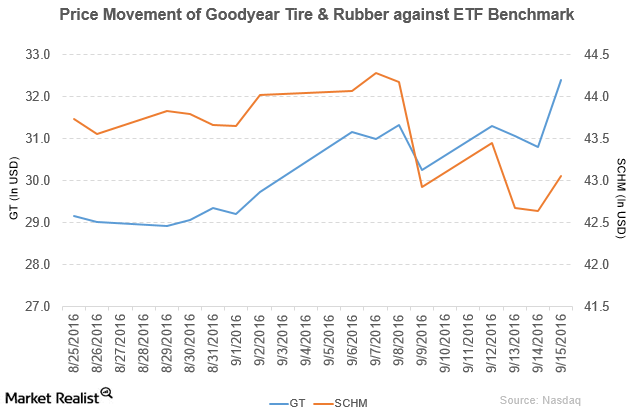
Goodyear Tire & Rubber’s Financial Targets and Quarterly Dividend
Goodyear Tire & Rubber Company (GT) has a market cap of $8.8 billion. It rose 5.1% and closed at $32.39 per share on September 15, 2016.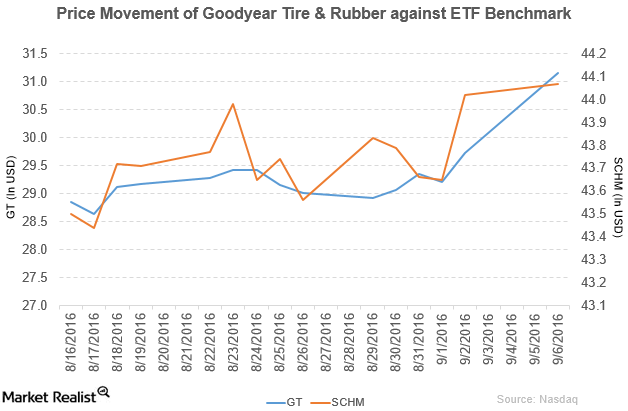
Deutsche Bank Upgrades Goodyear to ‘Buy’
The Goodyear Tire & Rubber Company (GT) has a market cap of $8.2 billion. It rose by 4.8% to close at $31.16 per share on September 6, 2016.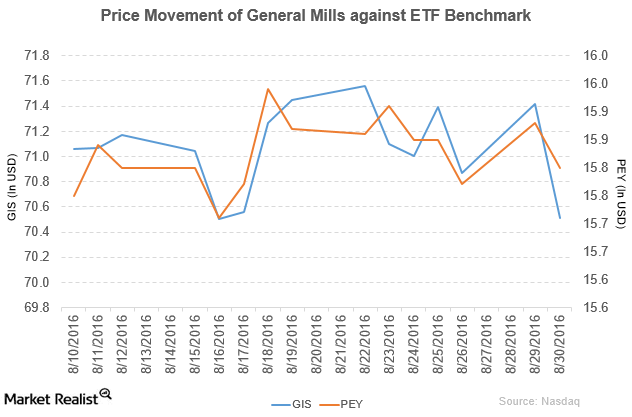
General Mills Made Key Changes in Its Management
General Mills (GIS) has a market cap of $42.6 billion. It fell by 1.3% to close at $70.51 per share on August 30, 2016.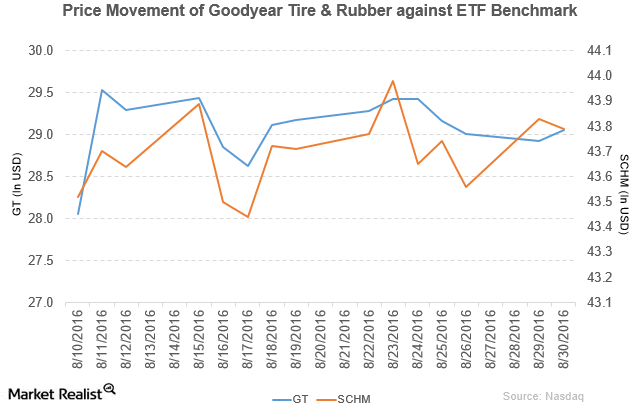
Goodyear Announces New Investment Plan to Meet Demand
Goodyear Tire & Rubber Company (GT) has a market cap of $7.7 billion. It rose by 0.45% to close at $29.06 per share on August 30, 2016.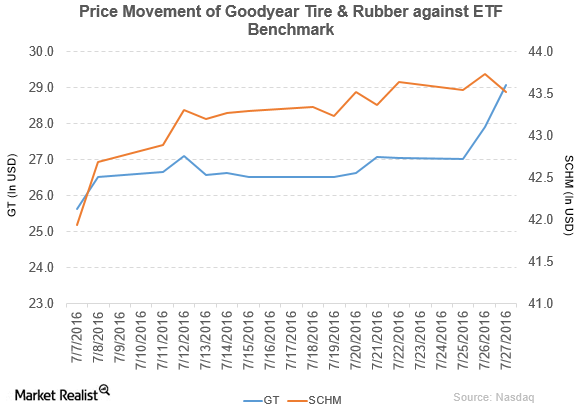
How Did Goodyear Tire & Rubber Perform in 2Q16?
Goodyear Tire & Rubber Company (GT) has a market cap of $7.8 billion. It rose by 4.2% to close at $29.09 per share on July 27, 2016.
Goodyear Tire & Rubber Declares Dividend of $0.07 Per Share
Goodyear Tire & Rubber Company (GT) has a market cap of $7.1 billion.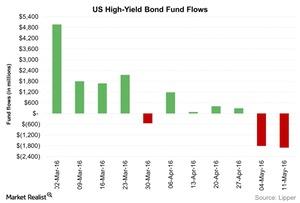
How Did High Yield Bond Fund Outflows Do Last Week?
Investor flows into high yield bond funds were negative last week for the second consecutive week. Net outflows from high yield bond funds totaled $1.9 billion.