US Stock Market Crash: What Does It Mean?
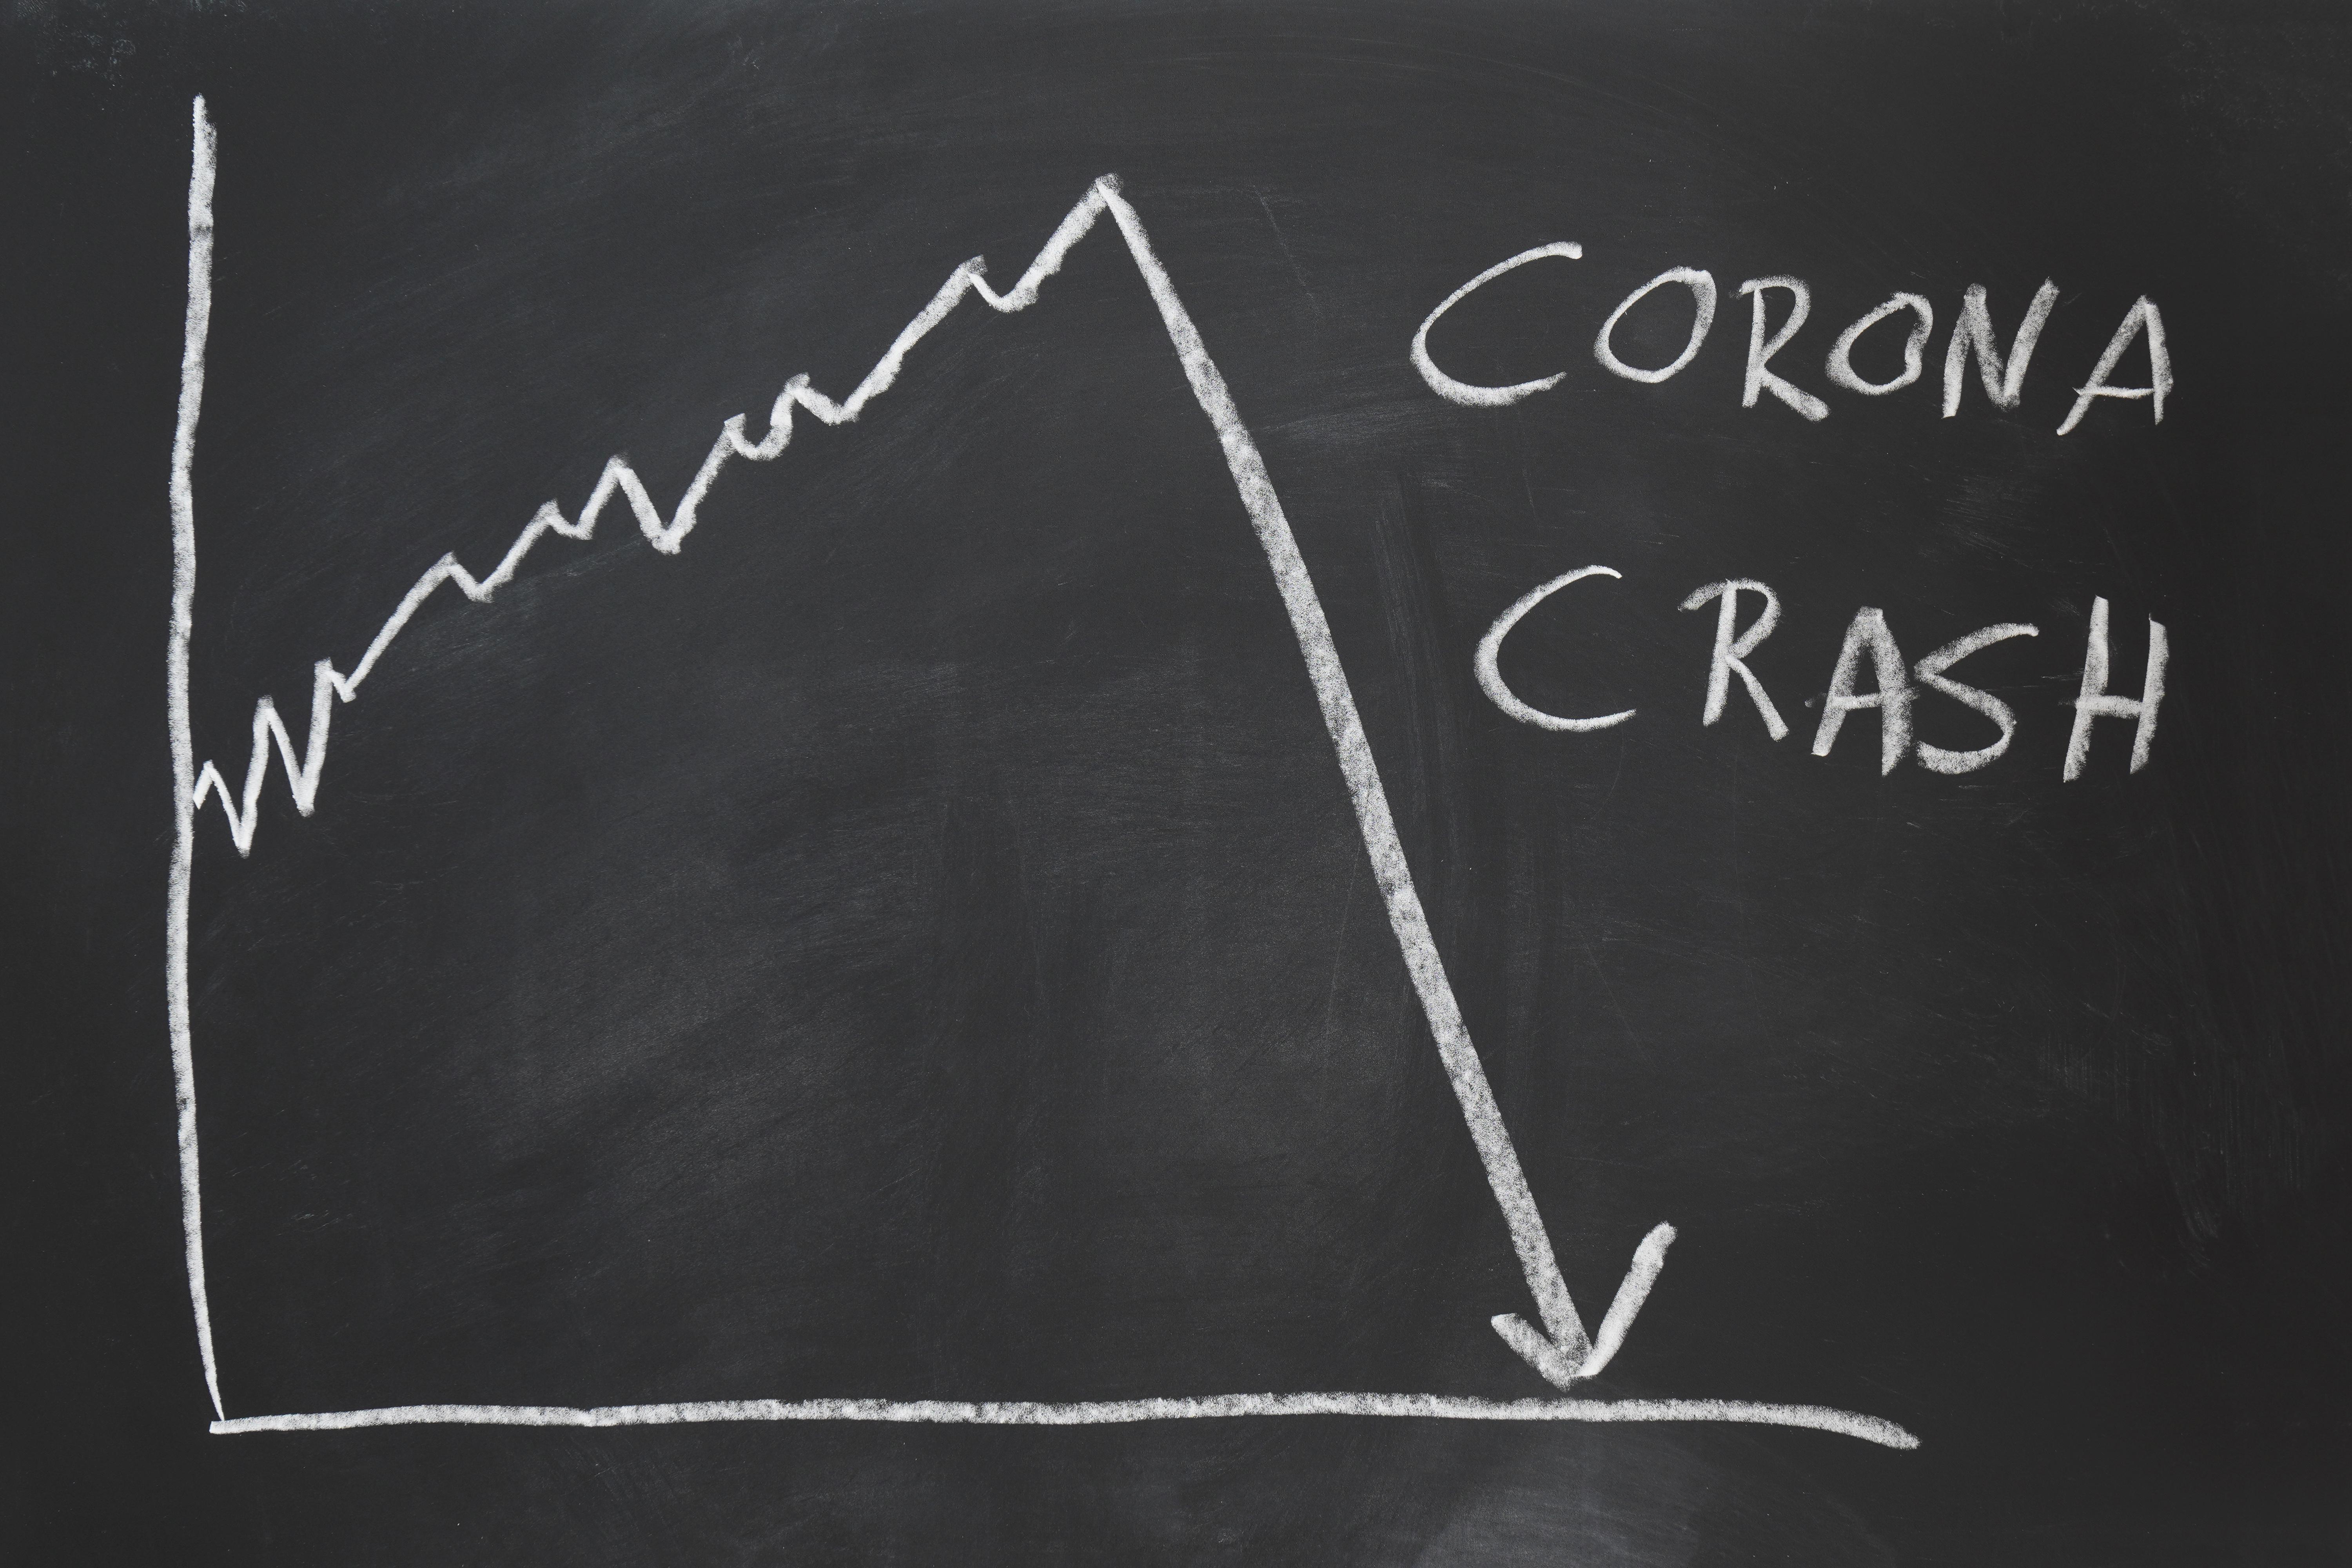
US stock markets continued to crash last week. The crash was the worst for the Dow Jones and the S&P 500 Index since the 2008 financial crisis.
Sept. 4 2020, Updated 6:52 a.m. ET

- US stock markets continued to crash last week. The crash was the worst for the Dow Jones and the S&P 500 Index since the 2008 financial crisis.
- In terms of severity, the current carnage has been even worse than in 2008 in terms of steepness. So far, the crash has created some scary records.
US stock market crash
US stock markets have crashed over the last month. The Dow Jones Index (NYSEARCA:DIA) has crashed by more than 10,000 points from its all-time highs in February. In percentage terms, the Dow Jones has fallen 35.2% from its all-time high. The S&P 500 (NYSEARCA:SPY) isn’t far behind. SPY has crashed 32.1% from its all-time high. In the 2008 financial crisis, US stock markets crashed 57% from their all-time highs.
Meanwhile, the Dow Jones crash has erased all of the returns under Trump’s presidency. He used to frequently highlight how US stock markets surged under his presidency. However, the carnage leaves President Trump with little to tweet on stock markets. Meanwhile, after making new record highs last year, US stock markets are making some scary records this year amid the crash.
Fastest bear market on record
Amid the stock market crash, all the indices, including the Dow Jones Index and the S&P 500, are in a bear market. Stocks falling 20% from their peak is termed as a “bear market.” The current bear market is the fastest on record. Notably, it only took 22 days for US stock markets to enter the bear market territory. To put that number in perspective, the metric was 294 days in the 2008 financial crisis. After the 2008 sell-off, US stock markets reclaimed their pre-crisis highs in 2013. When the current sell-off started in February, many people predicted a V-shaped recovery. However, hopes of a V-shaped recovery continue to fade and most expect a U-shaped recovery now.
Dow Jones and the S&P 500 have crashed this month
Last week was the worst for US stock markets since the 2008 financial crisis. The Dow Jones Index and the S&P 500 fell by more than 17% and 13%. In terms of the month-to-date price action, the Dow Jones has fallen by more than 24% this month. If the Dow Jones doesn’t recover from these levels, it would be its worst monthly fall since 1931. However, given the huge volatility in stock markets, it won’t be prudent to say how things would play out over the next week. To be sure, while US market crashes have made most of the headlines, earlier this month, we had the biggest single-day returns since the 2008 financial crisis.
Circuit breakers surge amid the US stock market crash
Stock exchanges globally have circuit breakers in place. In good times, like we had in the bull market since 2009, many people don’t know about these rules. However, there have been multiple circuit breakers this month. There have been four circuit breakers over the last two weeks. In terms of volatility, US stock markets have moved more than 9.0% for three consecutive trading days. The volatility was last seen during the Great Depression. US stock market volatility is at levels we saw during the Great Depression. Trading volumes are also running at record levels.
Dow Jones sees multiple 4% swings
The Dow Jones has seen multiple swings of 1,000 points over the last month. For comparison purposes, we’ll compare 4% price swings this year with the 2008 financial crisis. Between September 2008 and March 2009, there were a total of 28 instances when the Dow Jones moved more than 4.0% in one trading day. Over the last month, the Dow Jones has moved more than 4% on 11 instances. The Dow Jones moved more than 4% for eight consecutive trading days between March 9 and March 18.
Dow Jones Futures are pointing to a 4% swing today also. Overall, the US stock market crash is creating some scary records. The sell-off in equity markets and the expected recession might hurt Trump’s 2020 reelection chances.
