Stone Energy’s Stock Performance in 2018
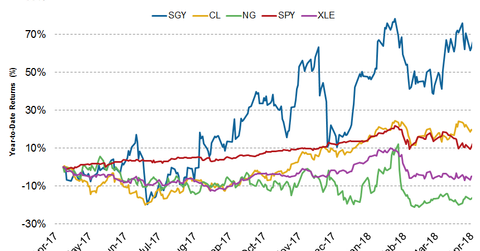
Stone Energy stock has increased the most among our top five companies. Stone Energy stock has risen 60% YoY (year-over-year).
Nov. 20 2020, Updated 12:36 p.m. ET

Stone Energy’s stock performance
In this part, we’ll discuss Stone Energy’s (SGY) stock performance. The company forecast the fifth-highest capex growth in 2018.
Stone Energy stock has increased the most among our top five companies. Stone Energy stock has risen 60% YoY (year-over-year). The Energy Select Sector SPDR ETF (XLE) has declined ~4.5% YoY, while the SPDR S&P 500 ETF (SPY) has risen ~11% YoY.
Crude oil prices (UCO) have risen ~19.5% YoY, while natural gas prices (UGAZ) have dropped 16.8% during the same period.
Crude oil accounted for 72% of Stone Energy’s 4Q17 production, while natural gas made up 21% of the total production.
Check out all the data we have added to our quote pages. Now you can get a valuation snapshot, earnings and revenue estimates, and historical data as well as dividend info. Take a look!
In addition to the capex, cash flow from operations is an important measure of a company’s performance. The free cash flow can be calculated by deducting capital expenditures from operating cash flows. To learn about the upstream companies that had the highest operating cash flow in 2017, read Fiscal 2017’s Top 5 Upstream Companies by Operating Cash Flow.
