National Oilwell Varco’s Q2 2018 Earnings and the Market
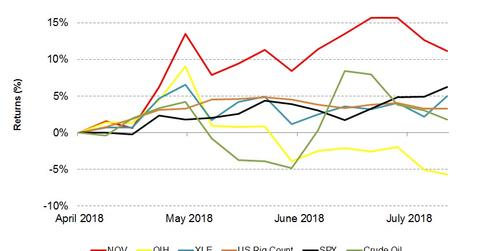
Since April 26 when National Oilwell Varco released its Q1 2018 financial results, NOV stock has risen 10%.
Nov. 20 2020, Updated 12:48 p.m. ET

National Oilwell Varco stock
National Oilwell Varco (NOV) released its financial results for Q2 2018 on July 26 after the market closed. Its stock rose 0.5% that day to $42.52 compared to the closing price on July 25.
WTI crude oil rose 0.4% on July 26 over the previous day’s close.
Check out all the data we’ve added to our quote pages. Now you can get a valuation snapshot, earnings and revenue estimates, and historical data, as well as dividend information. Take a look!
National Oilwell Varco’s returns and the industry
Since April 26 when National Oilwell Varco released its Q1 2018 financial results, NOV stock has risen 10%. NOV outperformed the VanEck Vectors Oil Services ETF (OIH), which has produced -8% returns in the past three months. OIH tracks an index of 25 OFS (oilfield equipment and services) companies.
The Energy Select Sector SPDR ETF (XLE), the broader energy industry ETF, has risen 3% since April 26. National Oilwell Varco has outperformed the SPDR S&P 500 ETF (SPY), which has risen 6% since April 26. The price of crude oil increased 2% in the past three months as of July 26. Read more on crude oil prices in Market Realist’s Geopolitical Turmoil Back: Which Oil-Weighted Stocks to Ride?
How other OFS companies reacted after their earnings releases
Carbo Ceramics (CRR), which also released its Q2 2018 financial results on July 26 before the market opened, saw a 4.8% rise in its stock that day. Schlumberger (SLB), which released its Q2 2018 financial results on July 20, saw a 1.2% fall in its stock that day.
Next, we’ll look at Wall Street analysts’ targets for National Oilwell Varco.
