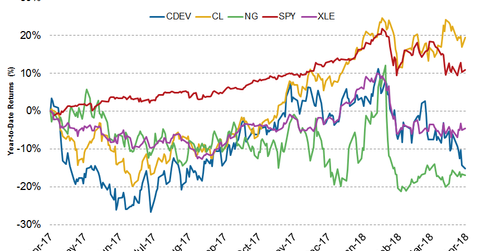
Centennial Resource Development: Stock Performance in 2018
Centennial Resource Development stock has declined ~15% YoY. The Energy Select Sector SPDR ETF (XLE) has declined ~4.5% YoY.
Nov. 20 2020, Updated 12:14 p.m. ET

Centennial Resource Development’s stock performance
Now, we’ll look at Centennial Resource Development’s (CDEV) stock performance. The company has the fourth-highest capex growth in 2018.
Centennial Resource Development stock has declined ~15% YoY (year-over-year). The Energy Select Sector SPDR ETF (XLE) has declined ~4.5% YoY, while crude oil prices (UCO) have increased ~19.5% YoY. Crude oil accounted for 65% of Centennial Resource Development’s total 2017 production, while natural gas accounted for 23% of the total production. Natural gas prices (UGAZ) have fallen 16.8% YoY.
XLE and Centennial Resource Development have underperformed the SPDR S&P 500 ETF (SPY), which has risen ~11% YoY.
Check out all the data we have added to our quote pages. Now you can get a valuation snapshot, earnings and revenue estimates, and historical data as well as dividend info. Take a look!
Centennial Resource Development was also one of the companies that forecast to report the highest revenue growth in 2017. Read What Could Drive Centennial Resource’s Revenues for 2017 to learn more. To learn about the top five companies that reported the highest revenues in 2017 on an absolute basis, read These Upstream Companies Reported the Highest Revenue in 2017.
