Analyzing Johnson & Johnson’s 1Q18 Profitability
Johnson & Johnson (JNJ) reported revenues of $20.0 billion during 1Q18, 12.6% growth as compared to revenues of $17.8 billion during 1Q17.
Nov. 20 2020, Updated 3:15 p.m. ET

Johnson & Johnson’s profitability
As discussed earlier, Johnson & Johnson (JNJ) reported revenues of $20.0 billion during 1Q18, which represents 12.6% growth, as compared to revenues of $17.8 billion during 1Q17. However, the gross profit margins have fallen in 1Q18, and the company reported a decrease in net profit margins during 1Q18 as compared to 1Q17.
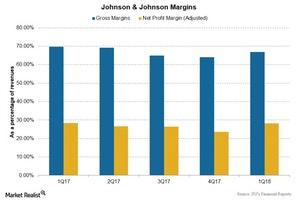
The above chart shows Johnson & Johnson’s profit margins since 1Q17.
Profit margins
The gross products margin decreased by ~2.7% to 66.9% during 1Q18 as compared to 69.7% during 1Q17. The decrease in gross profit margin was due to the higher cost of products sold as a result of the inclusion of new products in the product portfolio.
Also, the increased spending on research and development as well as increased selling, marketing, and administrative expenses resulted in the lower net profit margin. The company also reported other expenses of $60 million during 1Q18 as compared to other income of $219 million during 1Q17. The adjusted net profit margin fell to 28.2% during 1Q18 as compared to 28.4% during 1Q17. The company reported a net profit of $4.4 billion during 1Q18 as compared to a profit of $4.4 billion during 1Q17.
Financial guidance 2018
The company released its 2018 financial guidance on January 23, 2018, and announced changes in its financial guidance in 2018 on April 17, 2018. Sales are now estimated between $81.0 billion to $81.8 billion during 2018, which includes an operational increase in revenues by 4.0% to 5.0% and a ~2.0% positive impact of foreign exchange. The company also expects a negative impact of ~1.0% on revenues due to acquisitions and divestitures.
The earnings-per-share guidance remains the same, and the adjusted EPS is expected to be between $8.00 and $8.20 for 2018. The company now expects to improve the pre-tax operating margin by ~150 basis points during 2018.
The iShares Evolved US Innovative Healthcare ETF (IEIH) holds 10.1% of its total investments in Johnson & Johnson (JNJ), 5.7% in Merck (MRK), 4.1% in Bristol-Myers Squibb (BMY), and 4.8% in Biogen (BIIB).
Check out all the data we have added to our quote pages. Now you can get a valuation snapshot, earnings and revenue estimates, and historical data as well as dividend info. Take a look!
