Why the S&P 500 Index Is Considered a Leading Indicator
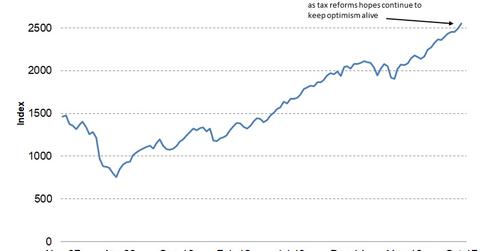
The S&P 500 Index has risen 2.2% in October and is en route to its eighth straight positive monthly close.
Nov. 30 2017, Updated 10:32 a.m. ET

The S&P 500 Index registers another milestone at 2,600
The S&P 500 Index has scaled a new peak near the 2,600 level. Strong corporate quarterly results and the continued hope for a corporate-friendly tax reform boosted stock market performance.
In October, there was a reduction in geopolitical risks, but the threat of another escalation is cannot be ruled out.
The S&P 500 Index (SPXL) which contains the largest 500 stocks in the US, is included in the Conference Board Leading Economic Index (or LEI). Stock prices represent the present value of future returns and are considered a leading indicator.
Although valuations and expectations cannot always be correct, they represent future expectations to an extent. As a result, stock prices are considered a forward indicator.
The S&P 500’s impact on the LEI
The S&P 500 Index has risen 2.2% in October and is en route to its eighth straight positive monthly close. The performance of the S&P 500 Index has a weight of ~4.0% on the Conference Board Leading Economic Index. For October, the index had a net positive impact of 10% on the LEI.
ETFs tracking the S&P 500 Index
The SPDR S&P 500 ETF (SPY), the iShares Core S&P 500 ETF (IVV), and the Vanguard S&P 500 ETF (VOO) track the performance of the S&P 500 Index and have each returned close to 16% year-to-date in 2017.
With the index reaching new peaks on a regular basis and with the possibility of tax cuts for the industry, we can expect the S&P 500 Index (UPRO) see continued support. This support depends on the outcome of the Trump administration’s tax reform initiatives.
In the next part of this series, we’ll analyze the performance of the Leading Credit Index in October.
