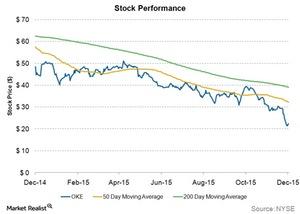
ONEOK: Trading 57% below Its 50-Day Moving Average
ONEOK (OKE) is currently trading 57% below its 50-day moving average. It’s generally been trading below its 50-day moving average since mid-2014 when energy prices began falling.
Dec. 14 2015, Published 10:00 a.m. ET

Well below 50-day moving average
ONEOK (OKE) is currently trading 57% below its 50-day moving average and 92% below its 200-day moving average. ONEOK has generally been trading below its 50-day moving average since mid-2014 when energy prices began falling.
The stock temporarily traded above its 50-day moving average from February to May 2015 when oil prices recovered a bit. OKE fell below the 50-day moving average again in May when it announced a 25% year-over-year decline in its 1Q15 cash flow available for dividends.
ONEOK recovered a bit along with crude oil prices in the first week of October 2015. Since then, the stock has continued to trade below its 50-day moving average. Despite a 2% increase in quarterly dividends compared to 2Q15 and a 26% year-over-year increase in cash flow available for dividends, OKE’s 3Q15 results could not revive its stock. The above graph shows ONEOK’s stock price, along with the 50-day and 200-day moving averages.
ONEOK’s year-to-date fall
ONEOK has fallen 59% since the start of 2015. Other midstream energy companies such as Enterprise Products Partners (EPD), Enbridge Energy Partners (EEP), and Enable Midstream Partners (ENBL) have also fallen 35%, 45%, and 56%, respectively, for the same period.
The Alerian MLP ETF (AMLP), an ETF consisting of top infrastructure MLPs, has fallen 37%. The Energy Select Sector SPDR ETF (XLE) has fallen 21% since the start of 2015.
In this series, we’ll analyze OKE’s price targets, the performance of OKE’s various segments, its leverage, distributable cash flows, capital expenditure, and dividend growth. We’ll also analyze its valuation relative to its historical valuation and to its peers. Finally, we’ll analyze the key drivers of ONEOK’s stock price.
