How GlaxoSmithKline’s Business Segments Performed in 1Q17
The company reported operational growth of 5% in its revenues to 7.4 billion pounds for 1Q17.
May 1 2017, Updated 7:40 a.m. ET

GlaxoSmithKline’s business segments
GlaxoSmithKline’s (GSK) business is divided into three business segments:
- Pharmaceuticals segment
- Vaccines segment
- Consumer health segment
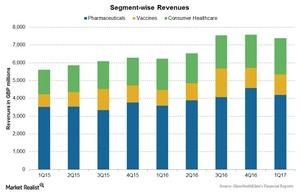
The company reported operational growth of 5% in its revenues to 7.4 billion pounds for 1Q17. The growth was driven by an increase in revenues across all three segments.
Segment-wise performance
The pharmaceuticals revenues have seen a shift in the product performance, and the revenues have fallen due to lower sales of key products Seretide and Advair, partially offset by increasing revenues from new products as well as HIV products Triumeq and Tivicay. Also, the divestment of the company’s oncology business to Novartis (NVS) will have a negative impact on both revenues as well as the profitability of this segment in the coming years. During 1Q17, the pharmaceuticals revenues rose ~4% at constant exchange rates to ~4,189 million pounds. Further details on the products and therapeutic areas are discussed later in the series.
For the vaccines segment, the inorganic growth from the acquisition of meningitis vaccines and other vaccines portfolio of Novartis in March 2015 has increased exposure and revenues for GSK’s vaccine segment. The revenues for the vaccines segment have increased ~16% at constant exchange rates to ~1,152 billion pounds in 1Q17.
The consumer health revenues rose ~2% at constant exchange rates to ~2,043 billion pounds in 1Q17. The increase was mainly due to the wellness and skin health franchise.
To divest the company-specific risks, investors can consider ETFs like the PowerShares International Dividend Achievers ETF (PID), which holds 2.4% of its total assets in GlaxoSmithKline. PID also holds 1.5% of its total assets in Sanofi (SNY), 1.1% in Novartis (NVS), and 1.1% in Teva Pharmaceuticals (TEVA).
