Reading the Performance of Mining Shares amid Surging Metals
On January 12, 2018, precious metals were once again on a rising streak, which also led to increasing prices for mining shares.
Jan. 19 2018, Updated 7:36 a.m. ET

Mining shares
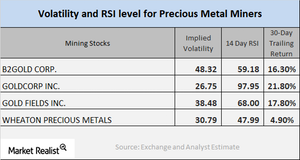
On January 12, 2018, precious metals were once again on a rising streak, which also led to increasing prices for mining shares. In this article, we’ll look at the implied volatility and RSI readings of precious metal mining companies. We have selected B2Gold (BTG), Goldcorp (GG), Gold Fields (GFI), and Wheaton Precious Metals for our analysis.
Volatility analysis
Volatility analysis measures the price changes in stocks with respect to the fluctuations in the price of their call options. The volatility readings of BTG, GG, GFI, and SLW are 48.3%, 26.8%, 38.5%, and 30.8%, respectively.
RSI levels
When a stock’s RSI (relative strength index) level is above 70, it indicates that it could be overbought and could decline. When a stock’s RSI indicator is below 30, it suggests that the stock could be oversold, and its price could potentially increase. BTG, GG, GFI, and SLW have RSI levels of 59.2, 98.0, 68.0, and 48.0, respectively.
Mining funds are known to be good indicators of the price movements of precious metals. The Global X Silver Miners ETF (SIL) and the VanEck Vectors Junior Gold Miners ETF (GDXJ) increased 2.2% and 2.9%, respectively, on January 12, 2018. These ETFs have five-day trailing gains of 3.0% and 1.3%, respectively.
