What’s the Outlook for Tyson?
Tyson Foods’ (TSN) sales dropped 11% in 2016 before gaining 4% in 2017.
Jan. 12 2018, Updated 9:03 a.m. ET

Tyson’s Foods’s sales recovered in 2017
Tyson Foods’ (TSN) sales dropped 11% in 2016 before gaining 4% in 2017. The company’s Beef, Pork, Chicken, Prepared Foods, and Other segments drove the decline in 2016. However, all of the segments contributed to the gain in 2017 with the exception of the Other segment.
What drove the EPS growth?
Gross profit grew 20% and 8% in 2016 and 2017, respectively. SG&A expenses increased 7% and 15% in 2016 and 2017, respectively. As a result, operating income grew 31% in 2016 and 3% in 2017. Adjusted operating income grew 26% and 15% in 2016 and 2017, respectively.
Interest expense decreased in 2016 before increasing in 2017. Adjusted net income grew 26% and 15% in 2016 and 2017, respectively. Adjusted diluted EPS grew 39% and 21% in 2016 and 2017, respectively. Share buybacks have enhanced the EPS numbers.
Dividend and price growth
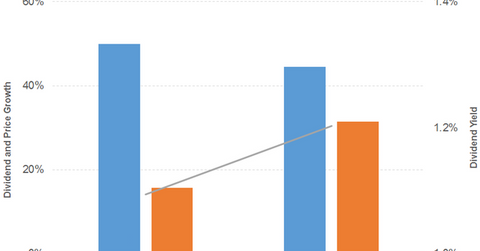
Dividend per share grew 50% and 44% in 2016 and 2017, respectively. Prices gained 16% and 31% in 2016 and 2017, respectively, which led to an upward sloping dividend yield curve. The company has a forward PE of 13.9x and a dividend yield of 1.5%. In comparison, the sector’s average forward PE is 24.8x, and the average dividend yield is 1.5%.
How does stock compare to the broad indexes?
The S&P 500 (SPX-INDEX) (SPY) has a dividend yield of 2.2%, a PE ratio of 23.4x, and a YTD return of 19.6%. The Dow Jones Industrial Average (DJIA-INDEX) (DIA) has a dividend yield of 2.2%, a PE ratio of 22.3x, and a YTD return of 25.1%. The NASDAQ Composite (COMP-INDEX) (ONEQ) has a PE ratio of 28.2x and a YTD return of 24.8%.
What is the net sales and EPS outlook?
Tyson Foods is projected to grow its net sales by 6% in 2018. The 2018 diluted EPS is projected to grow by 10%.
