How the Leading Credit Index Tracks US Credit Conditions
Understanding the Leading Credit Index The Conference Board LCI (Leading Credit Index), a constituent in the LEI (Leading Economic Index), is published every month and tracks credit conditions in the US economy by following changes in six financial market instruments: the two-year swap (SHY) spread (real time) the three-month LIBOR[1.Intercontinental Exchange London Interbank Offered Rate] (SCHO) […]
Jan. 5 2018, Updated 9:05 a.m. ET

Understanding the Leading Credit Index
The Conference Board LCI (Leading Credit Index), a constituent in the LEI (Leading Economic Index), is published every month and tracks credit conditions in the US economy by following changes in six financial market instruments:
- the two-year swap (SHY) spread (real time)
- the three-month LIBOR[1.Intercontinental Exchange London Interbank Offered Rate] (SCHO) less three-month Treasury bill (VGSH) yield spread (real time)
- debit balances in margin accounts at broker-dealers (monthly)
- the AAII Investors Sentiment Survey, bullish (%) less bearish (%) (weekly)
- the Senior Loan Officers C&I[2.commercial and industrial] Loan Survey, bank tightening credit to large (SPY) and medium companies (IWM) (quarterly)
- security repurchases (GOVT) (quarterly) from the total finance liabilities section of the Fed’s flow of funds report
Performance of the LCI in November
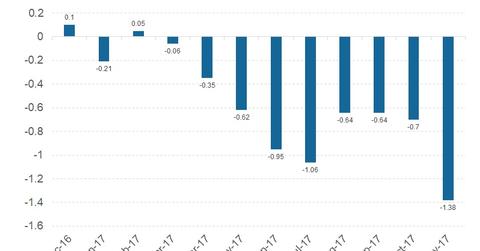
In November, the LCI stood at -1.4, improving from the revised October reading of -0.58. A negative value is considered positive for the economy. The lower the value, the easier it is to obtain credit. The LCI, which has a weight of 8.2% in the LEI, had a net positive effect of 0.11 (or 11%) on the overall LEI in November.
Credit conditions remain positive in November
Access to credit is an important consideration for businesses. Availability of credit is considered positive for the economy. Companies take on credit to invest and improve economic output. The LCI reached a 2017 high in November, a positive sign for the US economy in 2018. In the next part of this series, we’ll discuss the ongoing flatness of the yield curve.
