How Natural Gas ETFs Performed Last Week
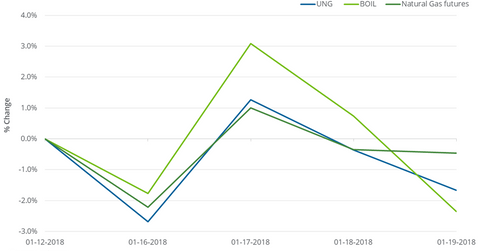
Between January 12 and January 19, 2018, the United States Natural Gas ETF (UNG), an ETF that has exposure to natural gas futures, fell 1.7%.
Jan. 22 2018, Published 9:34 a.m. ET

ETFs with exposure to natural gas
Between January 12 and January 19, 2018, the United States Natural Gas ETF (UNG), an ETF that has exposure to natural gas futures, fell 1.7%. This fall was 1.2 percentage points more than natural gas February futures’ fall between these two dates.
The ProShares Ultra Bloomberg Natural Gas ETF (BOIL), another ETF that has exposure to natural gas futures, fell 2.4% last week. BOIL’s large fall makes sense because the ETF aims to double the daily changes of the Bloomberg Natural Gas Subindex.
Performance analysis since 2016
Between March 3, 2016, and January 19, 2018, natural gas (GASL) (GASX) (FCG) active futures gained 94.3% after their 17-year low on March 3, 2016. Natural-gas-tracking ETFs’ performances over this period are as follows:
- UNG at 7.3%
- BOIL at -24.9%
This difference in the returns of these ETFs versus natural gas futures could be because of the “roll yield.” If active futures contracts are priced below the following month’s futures contract, this roll yield would be a cost for these ETFs.
In addition to this, the compounding effect of BOIL’s daily moves could lead to a greater difference between BOIL’s actual and expected returns.
As of January 19, 2018, natural gas futures’ closing prices for contracts until May 2018 were in a descending pattern, which would be an advantage for these ETFs.
