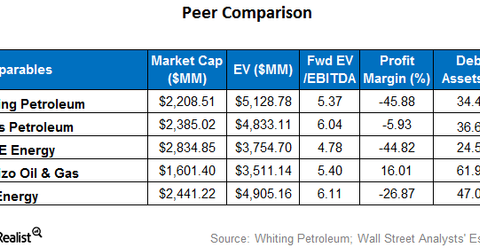
Where Whiting Petroleum Stands Next to Peers
Whiting Petroleum’s (WLL) forward EV-to-EBITDA multiple of ~5.4x is mostly in line with the peer average of 5.5x.
Dec. 14 2017, Updated 12:26 p.m. ET

Forward EV-to-EBITDA
Whiting Petroleum’s (WLL) forward EV-to-EBITDA (enterprise value to earnings before interest, tax, depreciation, and amortization) multiple of ~5.4x is mostly in line with the peer average of 5.5x.
Peer SM Energy (SM) is trading at a higher forward EV-to-EBITDA multiple of ~6.1x, while Oasis Petroleum (OAS) and Carrizo Oil & Gas (CRZO) are trading at slightly higher multiples of ~6.04x and ~5.4x, respectively. PDC Energy (PDCE) is trading at a lower multiple of 4.78x.
Profit margins
Among major peers, Whiting Petroleum and PDCE have the lowest profit margins of around -45.9%. WLL and PDCE reported higher net losses of $173 million and $292 million, respectively, in 3Q17, which helps explain their lower profit margins.
By comparison, Oasis reported a net loss of $41.2 million and SM Energy reported a net loss of $89 million 3Q17. Carrizo reported a net income of $5.5 million.
Debt-to-asset ratio
Carrizo has the highest debt-to-asset ratio among its peers at ~62%. SM Energy’s debt-to-asset ratio is the second-highest among peers at 47%, while PDC Energy has the lowest debt-to-asset ratio of ~24.5%.
Remember, a higher debt-to-asset ratio indicates that a higher proportion of a company’s assets are financed through debt, and so the higher the ratio, the higher the financial risk.
