Reading the Trends in Capacity Utilization across US Industries in October
Among the key macroeconomic indicators published by the Fed, capacity utilization in US industries helps investors forecast business cycle changes.
Nov. 22 2017, Updated 7:34 a.m. ET

Capacity utilization and the US economy
Among the key macroeconomic indicators published by the Federal Reserve, capacity utilization in US industries helps investors forecast business cycle changes. Changes in capacity utilization can give us insight into the future demand for products of an industry, demand for the labor market, inflation (TIP), and consumption.
In general, an increase in capacity utilization signals an increase in jobs, and this can lead to capital spending by industries where capacity utilization has peeked.
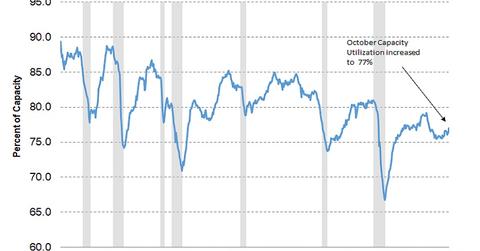
Capacity utilization, as the name suggests, is the percentage of capacity utilized out of total potential output. The average capacity utilization for all industries is 79.9% in the US. The durable goods manufacturing (XLU), electrical equipment (VPU), and appliances and components industries have the highest average capacity utilization rate of 82.4%.
Capacity utilization in October
According to the Industrial Production and Capacity Utilization report published by the Federal Reserve, total industry capacity utilization in October was 77%, compared with 76.4% in September. The manufacturing sector witnessed the highest increase in capacity utilization at 76.4%—its highest level in the past nine years.
Why investors track this industrial data
Capacity utilization and industrial production are indicators of the stage of the business cycle. Apart from business cycles, these indicators also act as forward indicators of inflation (VTIP).
The current trends in industrial production and capacity utilization signal a positive outlook for the US economy, which could keep the Fed on track in announcing its final interest rate (BND) hike for 2017 in December.
