How Did DVN’s Dividend Cut Affect Its Dividend Yield?
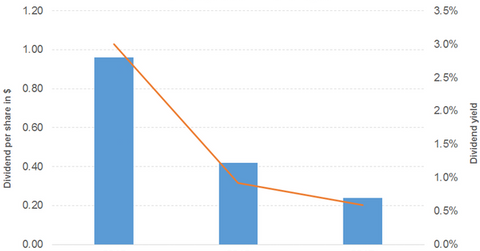
Devon Energy Corporation’s 56.0% dividend cut in 2016 was followed by a 43.0% cut in 2017.
Nov. 21 2017, Updated 10:30 a.m. ET

How did DVN’s revenues and EPS grow in 9M17?
Devon Energy Corporation’s (DVN) revenues recorded 13.0% growth in 9M17. Every segment drove the growth, which was offset by lower asset disposition. Its operating expenses decreased 32.0% in the absence of asset impairment and restructuring costs. As a result, the company recorded positive operating income in 9M17, unlike 9M16.
DVN’s other costs fell 66.0%, which translated into positive EPS (earnings per share) in 9M17, unlike 9M16. The company has not been able to generate positive free cash flow during this timeframe.
How has DVN’s dividend yield evolved over the years?
Devon Energy Corporation’s 56.0% dividend cut in 2016 was followed by a 43.0% cut in 2017. Its stock price has dropped 11.0% on a YTD (year-to-date) basis after a gain of 43.0% in 2016. This trend explains the company’s downward sloping dividend yield curve.
Devon Energy Corporation has a dividend yield of 0.6% and a YTD return of -10.6%. The sector’s average dividend yield is 1.6% and its PE ratio is 34.0x.
Comparison with broad indexes
The S&P 500 (SPX-INDEX) (SPY) offers a dividend yield of 2.3%, a PE ratio of 22.7x, and a YTD return of 15.5%. The Dow Jones Industrial Average (DJIA-INDEX) (DIA) has a dividend yield of 2.3%, a PE ratio of 21.2x, and a YTD return of 18.7%. The NASDAQ Composite (COMP-INDEX) (ONEQ) has a PE ratio of 25.4x and a YTD return of 25.4%.
The Vanguard International Dividend Appreciation Index Fund (VIGI) is a dividend ETF with 7.0% exposure to energy. It has a PE ratio of 26.8x and a dividend yield of 1.7%.
The PowerShares Dividend Achievers ETF (PFM) is a dividend ETF with 10.0% exposure to energy. It has a PE ratio of 20.1x and a dividend yield of 2.1%.
