How Closely Is Natural Gas Tracking Oil?
Between November 15 and 22, natural gas (UNG)(FCG) January futures had a correlation of 52.5% with US crude oil January futures.
Nov. 20 2020, Updated 10:59 a.m. ET

Past five trading days’ correlations
Between November 15 and 22, natural gas (UNG)(FCG) January futures had a correlation of 52.5% with US crude oil January futures. However, US crude oil (OIIL)(USL)(DBO) futures rose 4.5% while natural gas futures fell 3.8%.
Is natural gas following oil?
A fall of ~1.9 MMbbls (million barrels) in crude oil inventories for the first time in the last three weeks also supported oil prices on November 22. Moreover, the halt of the Keystone pipeline’s operations between Canada and the United States is helping oil prices stay strong.
On the other hand, supply concerns loom over natural gas prices. Parts 2 and 3 of this series also explain the recent bearishness in natural gas prices.
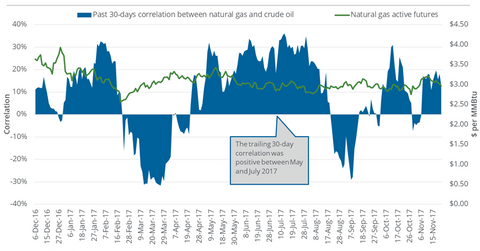
30-day rolling correlation
On November 22, the past-30-day rolling correlation between natural gas active futures and US crude oil futures was 12.9%. The 30-day rolling correlation between oil and natural gas prices has stayed over 30% on several instances between May and July 2017, which could point to a direct relationship between oil and natural gas prices. Often, natural gas prices can be a function of US crude oil prices. In fact, the same can be said of the energy sector as a whole.
Visit Market Realist’s Energy and Power page to learn more.
