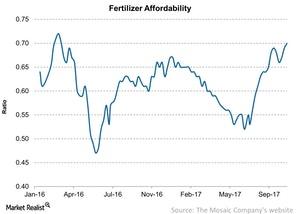
How Fertilizer Affordability Moved Last Week
Last week, the Fertilizer Affordability Index rose again week-over-week from 0.69x to 0.70x.
Nov. 1 2017, Updated 7:30 a.m. ET

Fertilizer affordability
In July 2017, it seemed like fertilizers were going to finish the year with high affordability. That changed later that month. The Fertilizer Affordability Index picked up the pace, continuing to gain momentum as of the date of this writing. Let’s look at it in more detail.
Index rises
Last week, the Fertilizer Affordability Index rose again week-over-week from 0.69x to 0.70x. The index is issued by Mosaic (MOS) and was indexed to one in the base year of 2005. A level below one indicates that the affordability for fertilizers is high compared to the base year, and a level above one means the opposite.
The index shows the relationship between the prices of key crop nutrients (or fertilizers) and the prices of key fertilizer-consuming crops in a single ratio. The index takes the weighted average of fertilizers such as urea, DAP (diammonium phosphate), and MOP (muriate of potash) over the weighted average prices of crops such as corn, soybeans, and wheat.
In its recent 3Q17 earnings call, PotashCorp (POT) stated that it expects a strong affordability for potash in North America (MOO) in 2017. It also stated that countries such as Thailand, Bangladesh, and Vietnam have benefited from strong affordability. High affordability remains one of the keys for improvement in earnings of companies such as PotashCorp, CF Industries (CF), and Agrium (AGU).
