Tracking the Conference Board Leading Economic Index
In this series, we’ll analyze each component of the Conference Board Leading Economic Index and understand its implications for the consumer discretionary (XLY), industrial (XLI), and housing (XHB) sectors and the overall market (SPY).
Sept. 27 2017, Updated 7:42 a.m. ET

The Conference Board Leading Economic Index
The Conference Board publishes three business cycle indicators every month. These business cycle indicators—the Leading Economic Index (or LEI), Coincident Economic Index (or CEI), and Lagging Economic Index (or LAG)—are followed by many in the investment and academic sectors. Investors need to monitor changes to these indexes for a view on where the economy is heading and how their investments could be affected.
Importance of the LEI
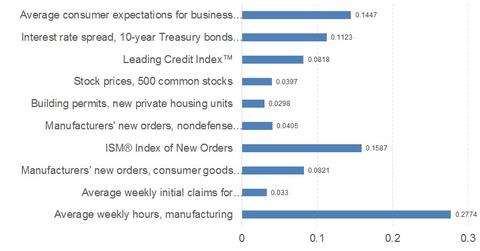
The LEI is based on ten economic indicators standardized to smooth volatility. Most of these indicators are leading indicators, meaning that their readings change before the underlying economy shows any signs of change.
Let’s consider the interest rate spread, which is an LEI component. The interest rate spread is the difference between the US ten-year Treasury (IEI) and federal funds rate (SHY). A narrow or negative interest rate spread has been proven to be a distress signal for the economy and often precedes a recession.
Series overview
August’s LEI was released on September 21. The US economy grew 0.4% in August, rising to 128.8 from a July index reading of 128.3. Seven of the ten components that make up the LEI rose in August, helping the index record reach a record high.
In this series, we’ll analyze each component of the Conference Board LEI and understand its implications for the consumer discretionary (XLY), industrial (XLI), and housing (XHB) sectors and the overall market (SPY).
