How the Gold-Silver Spread Is Trending
The gold-silver spread measures the price of one ounce of gold in relation to silver.
Aug. 1 2017, Updated 9:12 a.m. ET

Gold-silver ratio
When investors consider parking their money in precious metals, it’s crucial that they look at gold-silver spreads. Silver is often a more volatile metal than gold. Due to its low trading price compared to gold, silver volumes could remain higher.
Funds that closely track the rise and fall in gold and silver include the iShares Gold Trust (IAU) and the iShares Silver Trust (SLV). These two funds have seen YTD rises of 9.3% and 3.5%, respectively.
Spread measures
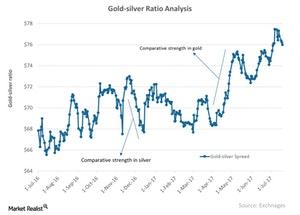
The gold-silver spread measures the price of one ounce of gold in relation to silver. As of July 27, the gold-silver spread was 75.8. This level indicates that it takes almost 76 ounces of silver to buy a single ounce of gold. The RSI (relative strength index) level of the gold-silver spread is at 29.7. Such a low level indicates the possibility of a revival in the spread.
As you can see in the graph above, the ratio has been steadily rising, which indicates that more ounces of silver are required to buy a single ounce of gold. Similarly, any fall in the ratio indicates strength for silver.
Mining stocks that are also considerably impacted by the interplay between gold and silver and the overall mining industry include Alamos Gold (AGI), Kinross Gold (KGC), Hecla Mining (HL), and Eldorado Gold (EGO).
