A Review of CF Industries’ Margin Trends
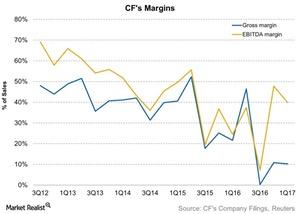
Over the past five years, CF Industries’ (CF) gross and EBITDA (earnings before interest, tax, depreciation, and amortization) margins have contracted.
June 16 2017, Updated 9:06 a.m. ET

CF Industries’ margins
Over the past five years, CF Industries’ (CF) gross and EBITDA (earnings before interest, tax, depreciation, and amortization) margins have contracted.
These contractions were likely the result of lower fertilizer prices. When fertilizer prices fall, fertilizer producers (NANR) such as CF Industries, PotashCorp (POT), The Mosaic Company (MOS), and Intrepid Potash (IPI) have little room to lower their production costs.
Margin trend
From 2012 to 2016, CF Industries’ gross margin expanded from 50% to ~26%. In 1Q17, CF Industries’ gross margin contracted to 10%, compared to 22% in 1Q16.
Similarly, the company’s EBITDA margin contracted from 55% in 2012 to ~31% in 2016. However, it expanded from 25% to 40% year-over-year in 1Q17.
The fertilizer business is highly capital intensive. Therefore, when selling prices fall below production costs, companies have the choice of either continuing operations in the short term, waiting for prices to rise, or idling their production facilities. Last year, many companies idled their production facilities with a price rise nowhere in sight.
CF Industries and PotashCorp moved their productions to lower-cost facilities to help maintain their margins. Several Chinese producers shut down their facilities as a result of falling urea prices.
Next, we’ll discuss CF Industries’ earnings trend.
