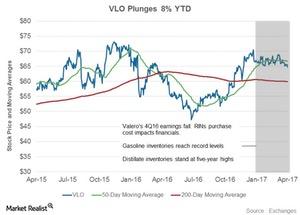
Understanding Valero’s Stock Performance Prior to the 1Q17 Results
Since February 2017, downstream stocks have been hit by volatile crack conditions and changing inventory levels. VLO has also witnessed volatility in its stock price.
Nov. 20 2020, Updated 2:59 p.m. ET

Valero’s seesaw ride
Refining sector stocks are impacted by several factors. Some of the primary ones are regional cracks, spreads, and refined product inventory levels in the industry. Since February 2017, downstream stocks have been impacted by volatile crack conditions and changing inventory levels. Valero Energy (VLO) stock has also witnessed volatility in its price.
However, VLO ended 2016 on a high note. This was likely due to the surge in the refining crack indicators of VLO in December 2016. In 4Q16, VLO stock crossed over its 50-day and 200-day moving averages. To be sure, the news that OPEC (Organization of the Petroleum Exporting Countries) had decided to cut production brought optimism to the energy sector.
Valero stock drops in 2017
Valero stock began 2017 on a strong note, and its refining margin indicators in the US Gulf Coast and the US Mid-Continent rose. However, on January 31, Valero released its 4Q16 earnings, which fell 55% YoY. Its earnings had been hit by large RIN (renewable identification number) costs, which are projected to stay at similar levels in 2017.
In February, EIA (US Energy Information Administration) reported a five-year high distillate inventory for the week ending February 3, 2017. This report was followed by record gasoline inventories for the week ending February 10, 2017, and by now it has declined.
The positive impact of the rise in refining margin indicators on Valero stock was thus offset by the negative impact of VLO’s 4Q16 earnings and record gasoline and distillate inventories in the market. VLO has plunged 8% year-to-date in 2017. However, due to a fall in the stock price in 1Q17, the stock broke below its 50-day moving average. VLO is now trading below 50-day moving average but above its 200-day moving average.
Peer stock performances
Since January 3, 2017, Delek US Holdings (DK), Western Refining (WNR), and Alon USA Energy (ALJ) have fallen 12%, 10%, and 11%, respectively.
For exposure to small-cap, value stocks, you might consider the iShares Russell 2000 Value ETF (IWN). IWN has ~5% exposure to energy sector stocks including DK, WNR, and ALJ.
