How the Gold-Platinum Spread Could Move More
The demand for platinum has been very fragile over the past few years, affected by the reduced market forecast for sales of diesel-based vehicles.
Feb. 13 2017, Published 4:04 p.m. ET

Platinum rose after Trump’s win
Platinum is known mostly for its use in jewelry and as an autocatalyst for diesel-based automobile engines. The demand for platinum has been very fragile over the past few years. Concerns surrounding the reduced market forecast for sales of diesel-based vehicles have affected demand.
After Donald Trump won the US presidential election in November 2016, platinum rose. It has risen 12.7% year-to-date.
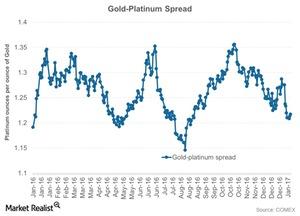
The above graph shows the performance of gold compared to platinum through the gold-platinum spread, or the gold-platinum ratio. The spread measures the number of platinum ounces it takes to buy an ounce of gold. The higher the ratio, the weaker platinum is compared to gold, because more ounces of platinum are needed to buy a single ounce of gold.
The prices of gold and platinum were $1,235.10 and $1,019.20 per ounce as of February 9, 2017.
RSI levels
The gold-platinum spread was ~1.2 on February 9, 2017. Platinum’s RSI (relative strength index) was 33. An RSI level above 70 indicates that an asset has been overbought and could fall. An RSI level below 30 indicates that an asset has been oversold and could rise.
Fluctuations in these precious metals are closely reflected in funds such as the ETFS Physical Platinum (PPLT) and the SPDR Gold Shares (GLD). Precious metal mining companies that fell in the past month include Pan American Silver (PAAS), Yamana Gold (AUY), Hecla Mining (HL), and New Gold (NGD).
