Coca-Cola Announces Its Expansion Plans
Coca-Cola’s net income and EPS fell to $1.0 million and $0.24, respectively, in 3Q16, compared to $1.4 million and $0.33 in 3Q15.
Dec. 7 2016, Updated 8:06 a.m. ET

Price movement
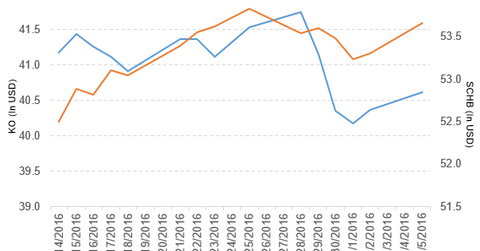
Coca-Cola Company (KO) has a market cap of $174.4 billion. It rose 0.64% to close at $40.62 per share on December 5, 2016. The stock’s weekly, monthly, and year-to-date (or YTD) price movements were -1.9%, -2.5%, and -2.4%, respectively, on the same day.
KO is trading 1.0% below its 20-day moving average, 2.0% below its 50-day moving average, and 5.9% below its 200-day moving average.
Related ETF and peers
The Schwab US Broad Market ETF (SCHB) invests 0.75% of its holdings in Coca-Cola. The YTD price movement of SCHB was 10.3% on December 5.
The market caps of Coca-Cola’s competitors are as follows:
Latest news on Coca-Cola
On December 5, 2016, Reuters reported, “Coca-Cola Co. opened a new $100 million facility in Cambodian capital Phnom Penh on Monday to expand its production capacity in the Southeast Asian nation.
“The plant, situated on a 12-hectare land in a special economic zone on the outskirts of the city, will employ 817 people and its will be powered by solar power, Prime Minister Hun Sen said at the inauguration ceremony.”
The report added, “’The investment is a part of Coca-Cola’s expansion, which began four years ago, said Irial Finan, executive vice president of Coca-Cola.”
Coca-Cola’s performance in 3Q16
Coca-Cola (KO) reported 3Q16 net operating revenues of $10.6 billion, a YoY (year-over-year) fall of 7.0% from its net operating revenues of $11.4 billion in 3Q15. The fall was due to the impact of foreign exchange and acquisitions, divestitures, and structural items.
The company’s gross profit margin and operating margin expanded 80 basis points and 60 basis points, respectively. The operating margin includes the impact of foreign exchange and structural changes.
Net income, EPS, and cash
Coca-Cola’s net income and EPS (earnings per share) fell to $1.0 million and $0.24, respectively, in 3Q16, compared to $1.4 million and $0.33 in 3Q15. It reported non-GAAP[1. generally accepted accounting principles] EPS of $0.49 in fiscal 3Q16—a YoY fall of 3.9%.
KO’s total cash, cash equivalents, and short-term investments rose 43.6% YoY, and its inventories fell 3.4% between 4Q15 and 3Q16.
