Is Enbridge Energy Partners’ Leverage a Concern?
Enbridge Energy Partners’ (EEP) debt-to-equity ratio is 1.1x. How do other midstream companies compare?
Nov. 14 2016, Updated 10:04 a.m. ET

EEP’s debt-to-equity ratio
Enbridge Energy Partners’ (EEP) debt-to-equity ratio is 1.1x. In comparison, midstream companies Plains All American Pipeline (PAA), ONEOK Partners (OKS), and Williams Partners (WPZ) have debt-to-equity ratios of 1.4x, 1.1x, and 0.8x, respectively.
EEP’s net debt-to-EBITDA ratio
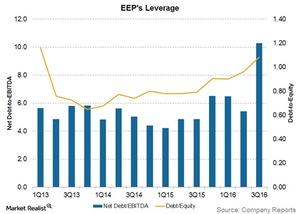
The graph above shows EEP’s quarterly debt-to-equity and net debt-to-EBITDA (earnings before interest, tax, depreciation, and amortization) ratios over the last four years. EEP’s net debt-to-EBITDA ratio is 10.3x.
As the graph shows, EEP’s net debt-to-EBITDA ratio rose significantly in 3Q16. While the company’s total debt hasn’t changed much compared to the previous quarter, the rise in its debt-to-EBITDA ratio can be attributed to the fall in its 3Q16 EBITDA.
During 3Q16, EEP wrote down ~$757 million relating to the long-term deferral of its Sandpiper pipeline project.
