A Look at WhiteWave Foods’ 3Q16 Performance
Price movement WhiteWave Foods (WWAV) has a market cap of $9.7 billion. It rose 0.78% to close at $54.47 per share on November 9, 2016. The stock’s weekly, monthly, and year-to-date (or YTD) price movements were 0.59%, 1.7%, and 40.0%, respectively, on the same day. WWAV is trading 0.37% above its 20-day moving average, 0.44% […]
Nov. 11 2016, Updated 10:04 a.m. ET
Price movement
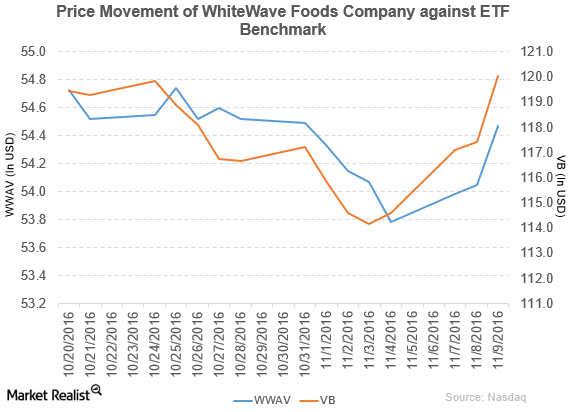
WhiteWave Foods (WWAV) has a market cap of $9.7 billion. It rose 0.78% to close at $54.47 per share on November 9, 2016. The stock’s weekly, monthly, and year-to-date (or YTD) price movements were 0.59%, 1.7%, and 40.0%, respectively, on the same day. WWAV is trading 0.37% above its 20-day moving average, 0.44% below its 50-day moving average, and 15.0% above its 200-day moving average.
Related ETF and peers
The Vanguard Small-Cap ETF (VB) invests 0.15% of its holdings in WhiteWave Foods. The ETF tracks the CRSP US Small Cap Index. The market-cap-weighted index includes the bottom 2%–15% of the investable universe. The YTD price movement of VB was 9.6% on November 9. The market caps of WhiteWave Foods’ competitors are as follows:
Performance of WhiteWave Foods in 3Q16
WhiteWave Foods reported 3Q16 net sales of $1.05 billion, a rise of 5.0% over the net sales of $1.00 billion in 3Q15, due to organic growth and acquisitions within the last year. The rise was partially offset by the negative impact of foreign exchange and the Fresh Foods platform’s results. Sales from the Americas Foods & Beverages and Europe Foods & Beverages segments rose 4.6% and 6.9%, respectively, between 3Q15 and 3Q16. The company’s gross profit margin and operating margin expanded by 120 basis points and 110 basis points, respectively.
Its net income and EPS (earnings per share) rose to $58.0 million and $0.32, respectively, in 3Q16, compared with $50.0 million and $0.28, respectively, in 3Q15. It reported adjusted EPS of $0.35 in 3Q16, a rise of 12.9% over 3Q15.
WWAV’s cash and cash equivalents and inventories rose 36.0% and 9.4%, respectively, between 4Q15 and 3Q16. Its current ratio rose to 1.2x, and its debt-to-equity ratio fell to 2.1x in 3Q16, compared with 1.0x and 2.5x, respectively, in 4Q15.
Projections
WhiteWave Foods has made the following projections for fiscal 2016:
- net sales growth of 8.5% to 9.5%
- adjusted total operating income growth of 16% to 18%
- adjusted EPS of $1.30 to $1.32
- adjusted EPS of $1.36 to $1.38, which excludes the China joint venture
Next, we’ll discuss GoPro (GPRO).