Why Are Precious Metals Showing Weakness?
Gold broke its key level of $1,300 per ounce on Tuesday, October 4, 2016. But investors are seeing gold’s 200-day moving average of $1,258 per ounce as a resistance level.
Oct. 6 2016, Updated 11:40 a.m. ET

Technicals for precious metals
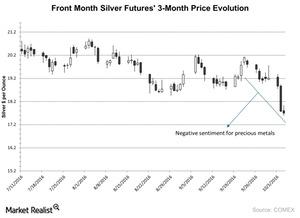
Gold broke its key level of $1,300 per ounce on Tuesday, October 4, 2016. But investors are seeing gold’s 200-day moving average of $1,258 per ounce as a resistance level. If gold manages to fall below this level, it could fall to $1,248 per ounce. The RSI (relative strength index) level for gold hit a low of 25.7 on Wednesday, October 5. The RSI for silver was 28.2.
An RSI level above 70 indicates that a stock has been overbought and could fall. An RSI level below 30 indicates that a stock has been oversold and could rise.
Platinum and palladium were trading at $976.60 and $675.60 per ounce, respectively, on Tuesday. Their RSI numbers were 27.2 and 42.0, respectively.
Weakened demand
According to Carsten Menke, an analyst at Julius Baer, “The stronger dollar, a break of the key technical levels, speculative positioning which was very long, weak physical Chinese and Indian demand all contributed.”
India and China, the largest buying markets, have slowed down. So prices may also fall, which could lead to an increase in demand.
Mining shares that have been the biggest losers over the past month include New Gold (NGD), Harmony Gold (HMY), First Majestic Silver (AG), and Sibanye Gold (SBGL). They fell 28.9%, 23.1%, 35.1%, and 25.5%, respectively, on a 30-day trailing basis.
Mining funds that fell during the same time include the PowerShares DB Gold ETF (DGL) and the PowerShares DB Silver ETF (DBS). These two funds fell 6.4% and 11.8%, respectively.
