Nasdaq Commodity Index: Reflecting the Global Commodity Market
On the commodities side, we have broad-based commodity benchmark, the Nasdaq Commodity Index, aptly named.
Oct. 3 2016, Published 11:11 a.m. ET

Market Realist: Nasdaq also offers a commodities index. Can you speak about that? Bloomberg has the BCOM Index and S&P has the S&P GSCI Index (GSG) to track commodities markets. Can you speak to the methodology that Nasdaq employs and how it differentiates from the pack?
Dave: Certainly. On the commodities side, we have a broad-based commodity benchmark, aptly named the Nasdaq Commodity Index. We designed this to focus on the reality of the physically settled US dollar-based futures market of commodities: aluminum, coal, ethanol, natural gas, WTI, etc. It’s the core, physically settled US dollar-traded commodity futures.
We wanted to take a real reflection of that market, so we looked at, as I call it, the commodity market cap, which is the open interest at a period of time multiplied by the price – so the equivalent of shares outstanding vs. price. We then consider commodity liquidity and volumes, so the average volume being traded multiplied by the average price. We blend those 2 factors to select and weight the commodities that go into our index, because you want to make sure that this is a representative benchmark, to the market interest within the commodities themselves. This is one way that we differ from our peers. Other commodity indexes use production weights or production data, which is very theoretical or very backward looking. Others will use a blend of production data and economic importance – how they view a particular commodity to be more economically important than other commodities. Some indexes use other methods, e.g., tracking 20 specific commodities.
We use a very objective approach. Each commodity included within the benchmark index gets its own index, gets its own roll schedule or roll calendar, and they get built up together to create that benchmark. One area in which we had some interesting development on this is a methodology that we call the hold methodology. For the third hold methodology, for example, instead of rolling the commodity each month, let’s take oil, if we’re in early June, we would have just rolled into the August contract or the front month, then in July we’ll go into September and just keep rolling that through. Instead, this methodology would actually go into October (not August or September), and it would hold that October contract all the way through that October roll, and then go into the January contract (not November or December), and then repeat that. It’s a methodology that reduces overall turnover and trading frictions. It’s still focused on the liquid contracts and liquid roll months, so it maintains a tradable aspect, and it helps mitigate the consequences of backwardization and contango and gives a more pure commodity return.
When we see this methodology play out over time, and it’s been live for over four years, it performs extremely similarly to other advanced or dynamic roll strategies. And we’re really happy about that because it’s a strategy that can perform very similarly to other more advanced strategies, but does so with a fraction of the overall trading. In terms of actual replications, it will pick up significant outperformance in that regard, and it will do so with a strictly rules-based approach. That makes it replicable – for example we publish the roll calendar every January so people will know exactly the cycle that the indexes will follow. It can definitely aid in that regard as well. That’s how we view the commodity market as a whole. We have some great products in Europe tracking the indexes that we’re very proud of from a geared perspective.
Market Realist’s View: The Nasdaq Commodity Index
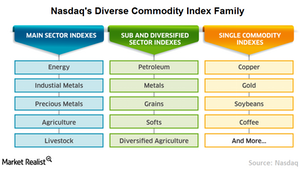
The Nasdaq Commodity Index Family provides significant exposure across major commodity (DBC) sectors. The index tracks US dollar–denominated commodities traded on US and UK exchanges. The family consists of individual and sector indexes based on 32 different futures-based commodities, with the primary benchmark being the Nasdaq Commodity Benchmark Index.
