LKQ Announced New Acquisition to Expand Its Presence in the UK
LKQ Corporation (LKQ) reported 2Q16 revenue of $2.5 billion, a rise of 38.9% compared to revenue of $1.8 billion in 2Q15.
Oct. 5 2016, Updated 7:04 p.m. ET

Price movement
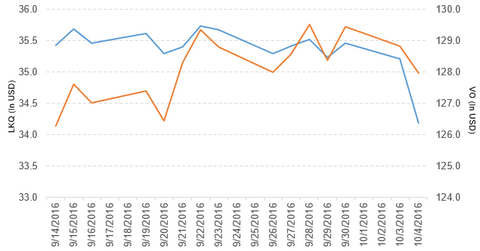
LKQ Corporation (LKQ) has a market cap of $10.4 billion. It fell 2.9% to close at $34.19 per share on October 4, 2016. The stock’s weekly, monthly, and year-to-date (or YTD) price movements were -3.5%, -4.5%, and 15.4%, respectively, on the same day.
LKQ is trading 3.7% below its 20-day moving average, 3.0% below its 50-day moving average, and 8.1% above its 200-day moving average.
Related ETF and peers
The Vanguard Mid-Cap ETF (VO) invests 0.28% of its holdings in LKQ. The ETF tracks the CRSP US Mid-Cap Index, a diversified index of mid-cap US companies. The YTD price movement of VO was 7.6% on October 4.
The market caps of LKQ’s competitors follow:
Latest news on LKQ
Euro Car Parts, a subsidiary of LKQ Corporation, has acquired all the business assets of Andrew Page Limited. These assets include 102 branch locations, a national distribution center, and a corporate office to expand its product portfolio and presence in the United Kingdom.
Performance of LKQ in 2Q16
LKQ Corporation (LKQ) reported 2Q16 revenue of $2.5 billion, a rise of 38.9% compared to revenue of $1.8 billion in 2Q15. Revenues in its North America, Europe, and Specialty segments rose 5.6%, 61.8%, and 18.5%, respectively, in 2Q16 compared to 2Q15.
LKQ’s gross profit margin fell 4.5%, and its operating income rose 21.4% in 2Q16 compared to 2Q15. It reported restructuring and acquisition-related expenses of $9.1 million in 2Q16 compared to $1.7 million in 2Q15.
Its net income and EPS (earnings per share) rose to $140.7 million and $0.46, respectively, in 2Q16 compared to $119.7 million and $0.39, respectively, in 2Q15. It reported adjusted EPS of $0.55 in 2Q16, a rise of 34.2% compared to 2Q15.
LKQ’s net receivables and inventories rose 68.6% and 21.5%, respectively, in 2Q16 compared to 4Q15. It reported cash and cash equivalents of $273.2 million in 2Q16 compared to $87.4 million in 4Q15. Its current ratio fell to 2.8x, and its debt-to-equity ratio rose to 1.5x in 2Q16 compared to a current ratio and a debt-to-equity ratio of 3.1x and 0.81x, respectively, in 4Q15.
Projections
LKQ Corporation (LKQ) has made the following projections for fiscal 2016:
- organic revenue growth for parts and service in the range of 5.5%–7.0%
- adjusted net income in the range of $555 million–$580 million
- adjusted EPS in the range of $1.79–$1.87
- cash flow operations in the range of $585 million–$635 million
- capital expenditures in the range of $200 million–$225 million
Next, we’ll discuss soft drink giant PepsiCo (PEP).
