How Are Those Cheerios Sales Going? Kellogg’s Earnings in Focus
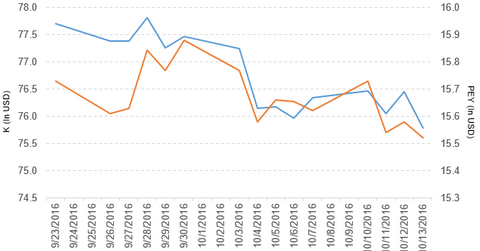
Kellogg (K) has a market cap of $26.4 billion. It fell 0.89% to close at $75.78 per share on October 13, 2016.
Oct. 14 2016, Updated 4:04 p.m. ET

Price movement
Kellogg (K) has a market cap of $26.4 billion. It fell 0.89% to close at $75.78 per share on October 13, 2016. The stock’s weekly, monthly, and year-to-date (or YTD) price movements were -0.25%, -3.0%, and 6.9%, respectively, on the same day.
K is trading 1.8% below its 20-day moving average, 5.1% below its 50-day moving average, and 0.75% below its 200-day moving average.
Related ETF and peers
The PowerShares High Yield Equity Dividend Achievers ETF (PEY) invests 1.5% of its holdings in Kellogg (K). The ETF aims to tracks a yield-weighted index of US companies that have increased their annual dividends for at least ten consecutive years. The YTD price movement of PEY was 19.3% on October 13.
The market caps of Kellogg’s competitors are as follows:
Latest news on Kellogg
In an October 13, 2016, press release, Kellogg reported, “Kellogg Company (NYSE: K) today announced it has entered into an agreement to acquire Ritmo Investimentos, controlling shareholder of Parati S/A, Afical Ltda and Pádua Ltda (‘Parati Group’), a leading Brazilian food group. The acquisition, the company’s largest in Latin America, furthers two of Kellogg’s strategic priorities — becoming a global snacking powerhouse and expanding its presence in emerging markets.”
The press release went on to say, “The acquisition by Kellogg, through its subsidiary Pringles Serviços e Comércio de Alimentos Ltda, is subject to customary closing conditions and is expected to close in late 2016. The purchase price is R$1.38 billion, or roughly US$429 million at current exchange rates, and it will be an all-cash transaction. To preserve financial flexibility, Kellogg intends to reduce its expected share repurchases in 2016 to $450-550 million, versus previous guidance of $700-750 million.”
Performance of Kellogg in 2Q16
Kellogg reported 2Q16 net sales of $3.3 billion, a fall of 5.7% compared to $3.5 billion in fiscal 2Q15. Sales from its US morning foods, US snacks, North America other, Europe, Latin America, and Asia Pacific segments fell 2.0%, 3.8%, 7.5%, 3.2%, 37.8%, and 2.6%, respectively, in 2Q16 compared to 2Q15. Sales from its US specialty segment rose 0.37% in the same period.
The company’s cost of goods sold as a percentage of its net sales fell 5.2%, and its operating profit rose 9.0% in 2Q16 compared to the prior year’s period.
Its net income and EPS (earnings per share) rose to $280.0 million and $0.79, respectively, in fiscal 2Q16, compared to $223.0 million and $0.63, respectively, in fiscal 2Q15.
Kellogg’s cash and cash equivalents rose 111.6%, and its inventories fell 2.7% in fiscal 2Q16 compared to fiscal 4Q15. Its current ratio and long-term debt-to-equity ratio rose to 0.65x and 3.1x, respectively, in fiscal 2Q16, compared to 0.56x and 2.5x, respectively, in fiscal 4Q15.
Projections
The company has made the following projections for 2016:
- currency-neutral comparable EPS of $4.11–$4.18
- currency-neutral comparable operating profit growth of 15.0%–17.0% due to the timing of price actions in its Venezuelan business
- currency-neutral comparable net sales growth of 4%–6%
- cash flow of ~$1.1 billion
Next, let’s take a look at PepsiCo (PEP).
