Gundlach Says This Chart Is ‘Early Warning Indicator’ of Recession
Jeffrey Gundlach seems quite bearish in his views about the US economy (IWM) (QQQ).
Nov. 22 2019, Updated 6:36 a.m. ET

An “early warning indicator of a recession”
Jeffrey Gundlach seems quite bearish in his views about the US economy (IWM) (QQQ). In June, he presented what he considered to be the most bearish chart for the US economy. The chart showed the dip in the S&P 500’s (IVV) (VOO) (SPY) return and profit margins. In a recent webcast, he presented a chart that he called an “early warning indicator of a recession.”
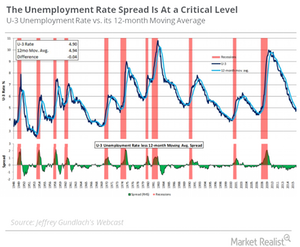
U-3 unemployment rate versus its 12-month moving average
According to Gundlach, there’s something important to note in the U-3 unemployment rate that US authorities put out every month relative to its 12-month moving average. As long as the unemployment rate stays below its 12-month moving average, there is “no chance of a recession,” according to Gundlach. However, during periods when the rate has surpassed its 12-month moving average, the US has experienced a recession.
Right now, we’re below the average by a very small amount, about four basis points. The point here is that any uptick in the U-3 unemployment rate could begin to hint at a recession. An uptick wouldn’t guarantee or predict a recession, but it would suggest that it’s a possibility.
U-3 unemployment versus its 36-month moving average
Now, comparing the U-3 rate to its 36-month moving average, one can see that the unemployment rate breaching the moving average line has resulted in a recession in the past. Currently, the unemployment rate isn’t even close to its 36-month moving average.
On the other hand, Gundlach sees evidence in other charts that seems to suggest that a recession isn’t in the cards yet. We’ll discuss these charts in the next articles.
