Inside Range Resources’ 3Q16 Earnings
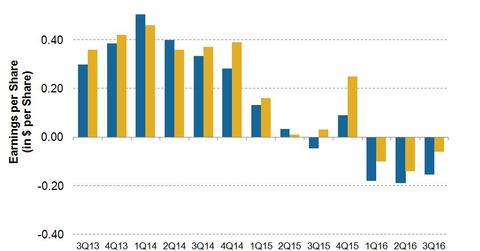
For 3Q16, Range Resources reported an adjusted loss per share of $0.06—$0.09 better than the Wall Street analyst consensus estimate of $0.15 loss per share.
Dec. 4 2020, Updated 10:53 a.m. ET

Range Resources beats 3Q16 EPS estimates
Range Resources (RRC) announced its 3Q16 earnings on October 25, 2016, after markets closed. Range Resources reported an adjusted loss per share of $0.06, which is $0.09 better than the Wall Street analyst consensus estimate of $0.15 loss per share.
RRC’s 3Q16 EPS (earnings per share) was $0.09 lower than its 3Q15 EPS of $0.03 but $0.08 per share higher than in 2Q16.
3Q16 revenues beat estimates
For 3Q16, RRC reported adjusted revenues of ~$402 million, which is ~10% better than the Wall Street analyst consensus estimate of ~$366 million. RRC’s 3Q16 revenues are ~16% lower than its 3Q15 revenues of ~$479 million but ~11% higher than revenues in 2Q16.
Earnings trend
Range Resources has reported lower EPS (earnings per share) since 2Q15 due to lower realized natural gas (UNG) prices. In 1Q16, RRC saw its adjusted earnings turn negative for the first time since 1999.
Notably, since 2013, RRC has beaten its earnings expectations ~67% of the time. Since 2013, upstream peers Denbury Resources (DNR), Pioneer Natural Resources (PXD), and Marathon Oil (MRO) have beaten earnings expectations ~57%, ~71%, and ~57% of the time, respectively.
In this series
In this series, we’ll analyze Range Resources’ 3Q16 cash flow, operational performance, and Wall Street analyst ratings. We’ll also look at the company’s price forecasts using implied volatility and review how its stock price has reacted to past earnings beats.
Let’s start with a look at RRC’s cash generation in 3Q16.
