Morgan Stanley Downgrades Coach to ‘Underweight’
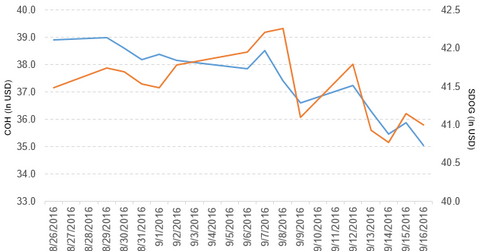
Coach (COH) fell 4.2% to close at $35.04 per share during the second week of September 2016.
Sept. 21 2016, Updated 8:05 a.m. ET

Price movement
Coach (COH) fell 4.2% to close at $35.04 per share during the second week of September 2016. The stock’s weekly, monthly, and year-to-date (or YTD) price movements were -4.2%, -9.9%, and 9.9%, respectively, as of September 16. COH is trading 8.0% below its 20-day moving average, 12.6% below its 50-day moving average, and 5.9% below its 200-day moving average.
Related ETF and peers
The ALPS Sector Dividend Dogs ETF (SDOG) invests 2.0% of its holdings in Coach. The ETF tracks an equal-weighted index of the five highest-yielding S&P 500 securities in each sector. The YTD price movement of SDOG was 17.4% on September 16.
The market caps of Coach’s competitors are as follows:
Coach’s rating
Morgan Stanley downgraded Coach’s rating to “underweight” from “equal-weight” and also set the stock’s price target at $32.0 per share.
Performance of Coach in fiscal 4Q16 and 2016
Coach reported fiscal 4Q16 net sales of $1.2 billion, a rise of 20.0% compared to net sales of $1.0 billion in fiscal 4Q15. The company’s gross profit margin fell by 1.0% in fiscal 4Q16 compared to the prior-year period.
Its net income and EPS (earnings per share) rose to $81.5 million and $0.29, respectively, in fiscal 4Q16 compared to $11.7 million and $0.04, respectively, in fiscal 4Q15. The company reported adjusted EPS of $0.45 in fiscal 4Q16, a rise of 45.2% compared to fiscal 4Q15.
Fiscal 2016 results
In fiscal 2016, COH reported net sales of $4.5 billion, a rise of 7.1% YoY (year-over-year). The company’s gross profit margin fell by 0.23%, and its operating income rose by 5.7% in fiscal 2016.
Its net income and EPS rose to $460.5 million and $1.65, respectively, in fiscal 2016 compared to $402.4 million and $1.45, respectively, in fiscal 2015.
Coach’s cash, cash equivalents & short-term investments, and inventories fell 13.3% and 5.3%, respectively, in fiscal 2016. Its current ratio and debt-to-equity ratio fell to 2.6x and 0.82x, respectively, in fiscal 2016 compared to 3.0x and 0.87x, respectively, in fiscal 2015.
Projections
The company has made the following projections for fiscal 2017:
- revenue growth in the low-to-mid single digits. This projection includes the benefit from foreign currency of ~1.0%–1.5%
- operating margin in the range of 18.5%–19.0%
- interest expense of ~$25 million
- a tax rate of ~28%
- double-digit net income growth
- double-digit EPS growth
Now we’ll look at Visteon (VC).
