How Has Gold Performed So Far in 2016?
Gold prices have gained 21% YTD in 2016 and closed at $1,308.40 on September 16, 2016.
Sept. 26 2016, Updated 10:05 a.m. ET

With volatility low and interest rates poised to rise, why hold gold? Russ discusses the important role it plays in a portfolio as a hedge.
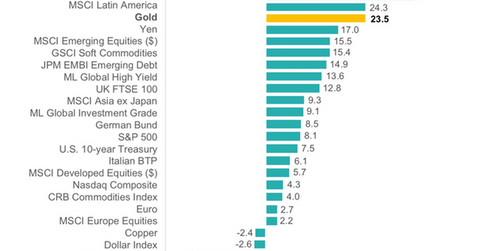
With U.S. stocks still flirting with their all-time highs and volatility scraping along close to a multi-year low, investors are less inclined to worry about hedging risks and downside protection. Coupled with expectations of rising interest rates, this has led to a modest selloff in gold. Given the magnitude of the rally in gold year-to-date (see the chart below), many are questioning whether now is a good time to sell some or all of their holdings in the precious metal.
Market Realist – 2016 holds a lot of promise for gold
Time and again we have witnessed the negative correlation between the S&P 500 and gold prices. Gold has proved to be the ideal performing investment, ranking just after commercial real estate investment trusts in the US.
Gold prices have gained 21% YTD in 2016 and closed at $1,308.40 on September 16, 2016. The prices commenced the new year on a positive note and recorded double-digit growth from the second week of February, breaching the 20% growth mark in mid-June.
The stupendous performance of the precious metal was driven by the weaker dollar, the easing monetary policy of the US, and global negative interest rates. The weak GDP results of the US had further postponed the Fed rate hikes. The PPI of gold has recorded a growth of 6% until now. Year-to-date, we’ve seen an average gold price of $1,256.
The S&P 500 had gained 6% YTD and closed at $2,139.20 on September 16, 2016. We can see from the chart how gold continued to remain among the top three assets in terms of its performance, outdoing the bonds and equities. The prices settled at 46.1 on August 1, 2016.
Gold price forecasts
Deutsche Bank is pretty adamant, with an outlook of $1,700 per ounce for gold in 2016. However, J.P. Morgan expects an average price of $1,040 per ounce for gold for the present year. Bank of America Merrill Lynch and ABN Amro expect the prices to fall below $1,000 per ounce. Citibank lowered its expected gold price 4.1% to $1,050 per ounce.
BNP Paribas lowered its 2016 expected price to $975 per ounce. HSBC lowered its gold price expectation by 5.5% to $1,205, due to the Fed’s overcautious approach, the strengthening dollar, lower global inflation rates, weak demand for gold from India and China, and the recovery in the US markets.
RBC Capital Markets expects the 2016 gold price to dip to $1,258 per ounce due to weakening demand in China. Reuters analysts are predicting a consecutive fall in demand for the third time in 2016. Macquarie Bank has also lowered its expected 2016 gold price 1.5% to $1,231 per ounce.
The SPDR Gold Shares ETF (GLD), the iShares Gold Trust ETF (IAU), the VelocityShares 3x Long Gold ETN (UGLD), and the PowerShares DB Gold ETF (DGL) rose 23.3%, 23.6%, 73.7%, and 22.4% YTD, respectively, in 2016. The DB Gold Double Short ETN (DZZ) dipped 39.4% YTD in 2016.
