Are MAP Prices Beginning to Lift?
MAP (monoammonium phosphate) is the second most used phosphate fertilizer after DAP (diammonium phosphate).
Aug. 18 2020, Updated 5:25 a.m. ET

MAP prices
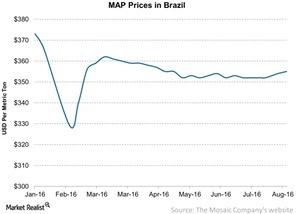
MAP (monoammonium phosphate) is the second most used phosphate fertilizer after DAP (diammonium phosphate). In the week ended August 5, 2016, average MAP prices in Brazil inched up $355 per metric ton from $354 per metric ton in the previous week.
This week’s price movement is in line with our analysis on its direction last week. In our price series last week, we noted, “MAP prices have had consolidates at the current levels for a few weeks. Last week’s increase may show signs of a positive direction for prices.”
This week’s price rise continues to give a positive signal to fertilizer producers who worry that more price falls could hurt their margins.
Year-over-year prices
In the week ended August 5, 2016, average MAP prices were lower than they were a year earlier. They averaged $355 per metric ton last week, which was 26% lower than their average price of $481 per metric ton in the same week last year.
Fertilizer companies and ETFs
Despite MAP prices falling over the past year, they seem to be recovering and staying above the low of $329 per metric ton that we saw in the second half of February 2016.
The Mosaic Company (MOS), PotashCorp (POT), Israel Chemicals (ICL), and Agrium (AGU) produce phosphate fertilizers. They’re impacted by falling fertilizer prices. You can consider investing in the iShares Global Materials ETF (MXI), which invests about 3.7% of its portfolio in DuPont (DD) and ~3% in Monsanto (MON).
In the next part of this series, we’ll look at prices for potash fertilizers, the third key crop nutrient after nitrogen and phosphate.
