BP’s Forward Valuations: A Peer Comparison
In this article, we’ll consider BP’s forward valuations compared to those of its peers. BP’s market cap stands at ~$105 billion.
Aug. 25 2016, Updated 11:04 a.m. ET

BP’s peer comparison
Earlier, we discussed why BP (BP) was trading higher than its historical valuations. In this article, we’ll consider BP’s forward valuations compared to those of its peers.
Before we proceed with a peer comparison, let’s consider the market caps of some integrated energy companies. BP’s market cap stands at ~$105 billion.
Among BP’s peers, ExxonMobil (XOM) has the highest market cap of ~$364 billion. Chevron (CVX), Total (TOT), and Royal Dutch Shell (RDS.A) have market caps of ~$193 billion, ~$115 billion, and ~$201 billion, respectively.
If you’re looking for exposure to XOM and CVX, you can consider the iShares Russell 1000 Value ETF (IWD), which has ~13% exposure to energy sector stocks.
BP’s forward valuations
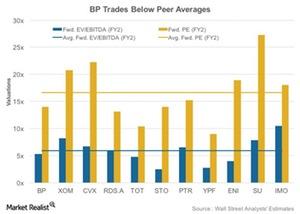
BP is currently trading at a two-year forward EV-to-EBITDA (enterprise value to earnings before interest, tax, depreciation, and amortization) of 5.3x, below the peer average of 5.9x. Total, Statoil (STO), and YPF (YPF) are also trading below the peer average.
In terms of price-to-earnings (or PE), BP is trading at two-year forward PE of 14x, lower than the peer average of 16.6x.
Why is BP trading at a discount to XOM and CVX?
BP could be trading at a discount to its peers XOM and CVX due to the fact that they’re better placed in terms of capital structure. BP’s total debt-to-capital ratio stands at 37% compared to XOM and CVX’s average of 22%.
For the past few years, BP has been struggling with its Gulf of Mexico oil spill charges, which are ~$62 billion to date on a pretax basis. Lower oil prices have also impacted BP’s leverage and cash position to a greater degree than XOM and CVX. These issues are likely weighing on the stock compared to its peers.
In next and final article, we’ll discuss the correlation between BP’s stock and crude oil’s price.
