How DAP- and MAP-Producing Countries Stack Up on the Cost Curve
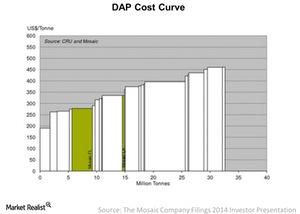
In 2014, the cost of production for DAP per ton ranged from $190 to $450 per metric ton, as we can see in the chart.
July 28 2016, Updated 11:07 a.m. ET

Cost curve
Earlier, we discussed that with respect to the profitability of fertilizers—or any commodity—a company depends on the spread between the cost curve and realized prices in the market. Let’s look at this in detail.
Understanding cost curves
In the chart above, you can see production capacity in million tons on the X axis and price per metric ton on the Y axis. As we move to the right, the cost of producing DAP and MAP also increases.
In 2014, the cost of production for DAP per ton ranged from $190 to $450 per metric ton, as we can see in the chart.
How the cost curve drives prices
According to Bloomberg, the DAP and MAP production cost in 2015 at the lowest (left) end was ~$100 per metric ton. As we move to the right on the chart, the cost of production moves higher, at ~$400 per metric ton. This is the supply side that affects prices.
Recall that the global demand for phosphate fertilizer is estimated to be ~41.8 million metric tons in the 2015–2016 planting season. This is the demand side that affects the prices.
The prices are a function of supply and demand. The prices for phosphorous fertilizer ranged from $276 to $341 per metric ton for DAP. MAP was trading at ~$352 per metric ton on July 15, 2016.
The current price floor appears to range from $350 to $400 per metric ton. The price floor is set by the marginal producer at the current demand levels, which in this case is Latin America.
The spread of profitability
The spread between a producer’s cost of production and the price floor determines its profitability. When there is a spike in demand for fertilizers, the prices may spike. In this case, a producer gains to benefit, as capacity cannot be added fast enough to keep pace with demand.
Demand can be more volatile than supply due to unexpected changes in weather conditions, stock-to-use, and inventory levels. This is why earnings of fertilizer producers (MOO) such as Mosaic (MOS), PotashCorp (POT), Agrium (AGU), and CF Industries (CF) jumped when the demand spiked a few years ago.
As demand spiked, producers’ profitability increased and many reinvested profits into capacity addition. With capacity addition happening faster than demand, fertilizer prices took a hit. With the fertilizer industry sitting at the bottom of its cycle, let’s look at what future may hold for phosphate prices.
