Can ~6% Pricing Variance Help Philip Morris’s Margin Rise in 2Q16?
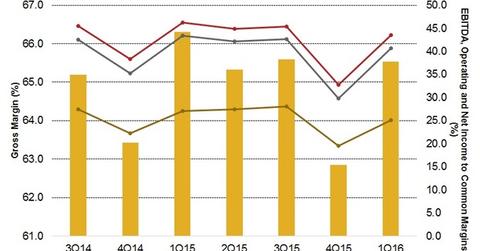
As a result of decreased operating income, Philip Morris’s (PM) operating margin fell by 2.8% to 41.9% in 1Q16.
July 13 2016, Updated 12:05 p.m. ET

1Q16 gross margin and free cash flow
Philip Morris’s (PM) gross margin fell by 0.7 points to 65.5% in 1Q16 compared to 66.3% in 1Q15. Despite the adverse currency impact, Philip Morris is focused on generating strong free cash flow in line with last year’s level.
The company’s free cash flow (or FCF) increased by over $300 million in 2015 to reach $6.9 billion for the fiscal year.
Philip Morris’s (PM) reported operating income fell by 13.9% to $2.5 billion in 1Q16 compared to ~$3.0 billion in 1Q15. The decrease was primarily due to the negative impact of foreign currency of $0.4 billion. However, on a constant-currency basis, the reported operating income decreased by 0.9% in 1Q16.
The company’s adjusted operating income, excluding unfavorable currency impact, decreased by 0.9% in 1Q16. This was primarily due to unfavorable volume and mix of $0.2 million, mainly due to EEMA and Asia, as well as higher costs in support of reduced-risk products. This was partially offset by favorable pricing, volume, and mix in Latin America and Canada.
Operating margin versus peers
As a result of decreased operating income, Philip Morris’s (PM) operating margin fell by 2.8% to 41.9% in 1Q16. Similarly, Altria Group’s (MO) 1Q16 operating margin fell by 2 basis points to ~43.6% in 1Q16. The impact on the operating margin was due to higher pricing, volume, and the benefit of the federal tobacco quota buyout expiration.
However, Reynolds American’s (RAI) operating income increased by 786.3% to ~$6.1 billion. This includes financing costs for the Lorillard acquisition and related divestitures to Imperial Tobacco Group (ITYBY). As a result, its reported operating margin increased to 211.6% in 1Q16.
Pricing in line with average
Philip Morris expects a pricing variance of ~6% in 2016, which will help the company achieve full-year pricing broadly in line with its historical annual average. However, higher pricing could affect the volume of premium-priced and mid-priced brands and hence, its profitability. Higher prices could reduce volumes.
On July 9, 2016, Philip Morris (PM) comprised 1.3% of the iShares Core US Value ETF (IUSV).
In the coming parts, we will discuss stock price movement as well as Philip Morris’s valuation of PM for 2Q16.
