Chart in Focus: Denbury Resources’ Free Cash Flow
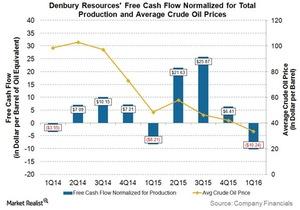
In 1Q16, Denbury Resources’ reported free cash flow normalized for total production of ~-$10 per boe (barrel of oil equivalent), ~$2 lower compared to 1Q15.
July 12 2016, Updated 6:04 p.m. ET

Denbury Resources’ free cash flow normalized for production
In 1Q16, Denbury Resources’ (DNR) reported FCF (free cash flow) normalized for total production of ~-$10 per boe (barrel of oil equivalent), ~$2 lower compared to 1Q15.
As seen in the above chart, Denbury Resources’ FCF normalized for total production fell substantially in the last two quarters. This was mainly due to its much lower operating cash flows as a direct result of lower realized crude oil prices (USO) and lower hedging effectiveness.
In 1Q16, other upstream companies Murphy Oil (MUR), Energen Corporation (EGN), and Pioneer Natural Resources (PXD) also reported lower year-over-year FCFs normalized for total production.
