Greif Declared Quarterly Dividends
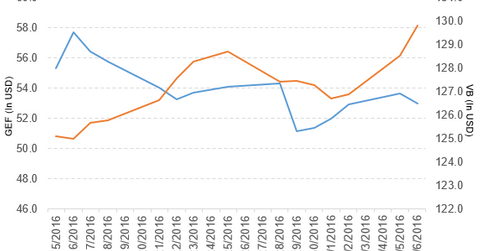
Greif (GEF) has a market cap of $2.8 billion. It fell 1.2% to close at $52.98 per share on December 6, 2016.
Dec. 7 2016, Updated 5:05 p.m. ET

Price movement
Greif (GEF) has a market cap of $2.8 billion. It fell 1.2% to close at $52.98 per share on December 6, 2016. The stock’s weekly, monthly, and year-to-date (or YTD) price movements were 3.5%, 14.0%, and 78.1%, respectively, on the same day. GEF is trading 0.12% above its 20-day moving average, 6.5% above its 50-day moving average, and 32.9% above its 200-day moving average.
Related ETF and peers
The Vanguard Small-Cap ETF (VB) invests 0.03% of its holdings in Greif. The YTD price movement of VB was 18.5% on December 6.
The market caps of Greif’s competitors are as follows:
Greif declared dividend
Greif has declared quarterly cash dividends of $0.42 per share and $0.62 per share on its Class A and Class B common stock, respectively. The dividends will be paid on January 1, 2017, to shareholders of record at the close of business on December 19, 2016.
Greif 3Q16 performance
Greif reported 3Q16 net sales of $845.0 million, a fall of 9.1% compared to its net sales of $930.0 million in 3Q15. Net sales from the company’s Rigid Industrial Packaging & Services, Paper Packaging & Services, and Flexible Products & Services segments fell 10.8%, 2.4%, and 11.7%, respectively, compared to 3Q15. Sales from its Land Management segment rose 13.7% in 3Q16 compared to 3Q15.
The net income and EPS (earnings per share) of Greif’s Class A stock and the EPS of Greif’s Class B stock rose to $46.1 million, $0.78, and $1.18, respectively, in 3Q16, compared to $8.6 million, $0.15, and $0.22, respectively, in 3Q15.
The company reported consolidated EBITDA[1. earnings before interest, tax, depreciation, and amortization] of $101.2 million in 3Q16, a rise of 29.7% compared to 3Q15. GEF’s cash and cash equivalents and inventories fell 11.2% and 2.9%, respectively, in 3Q16 compared to 4Q15.
Projections
Greif made the following projections for 2016:
- Class A EPS before special items in the range of $2.36–$2.56
- capital expenditure in the range of $95 million–$110 million
- free cash flow in the range of $160 million–$190 million
In the next part, we’ll look at J.M. Smucker (SJM).
