Key Support and Resistance Levels for US Crude Oil Futures
August US crude oil futures key support level is $43 per barrel. Prices tested this level three times in the last 15 months.
June 26 2017, Updated 1:36 p.m. ET

Energy calendar this week
Let’s track some important events for crude oil and natural gas on June 26–30, 2017.
- Tuesday, June 27, 2017 – The American Petroleum Institute will release its weekly crude oil inventory.
- Wednesday, June 28, 2017 – The EIA (U.S. Energy Information Administration) will release weekly crude oil and gasoline data.
- Thursday, June 29, 2017 – The EIA will release its weekly natural gas storage report.
- Friday, June 30, 2017 – Baker Hughes will release its weekly US oil and gas rig count report.
Crude oil futures
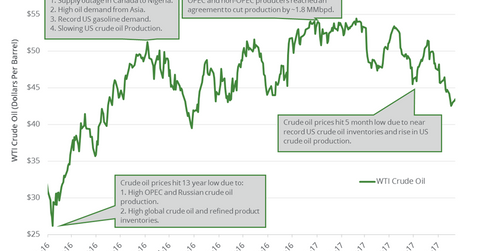
August US crude oil (USO) (UCO) (PXI) (USL) prices have fallen 13% in the last 12 months. So far, crude oil prices have fallen 23.50 in 2017 due to bearish drivers.
Peak and low
US crude oil prices settled at $54.45 per barrel on February 23, 2017—the highest level since June 2015. On the other hand, crude oil prices hit $26.21 per barrel on February 11, 2016—the lowest level in 13 years. Lower crude oil prices have a negative impact on oil producers like Stone Energy (SGY), Chevron (CVX), and Denbury Resources (DNR).
Support and resistance levels
August US crude oil futures’ key support level is $43 per barrel. Prices tested this level three times in the last 15 months. The next two important support levels are $40 and $38 per barrel, respectively.
August US crude oil futures’ key resistance levels are at $48 and $51 per barrel, respectively. Prices tested these levels multiple times in the last six months.
August US crude oil futures are below their 20-day, 50-day, 100-day, and 200-day moving averages, respectively, as of June 23, 2017. It suggests that prices could trade lower in the short term.
In the next part, we’ll look at how Cushing crude oil inventories impact prices.
